. 2012 Aug 2;31(31):3569-83.
doi: 10.1038/onc.2011.547. Epub 2011 Dec 5.

Modeling invasive breast cancer: growth factors propel progression of HER2-positive premalignant lesions

Affiliations

Modeling invasive breast cancer: growth factors propel progression of HER2-positive premalignant lesions

C-R Pradeep et al. Oncogene. .

Erratum in

Abstract

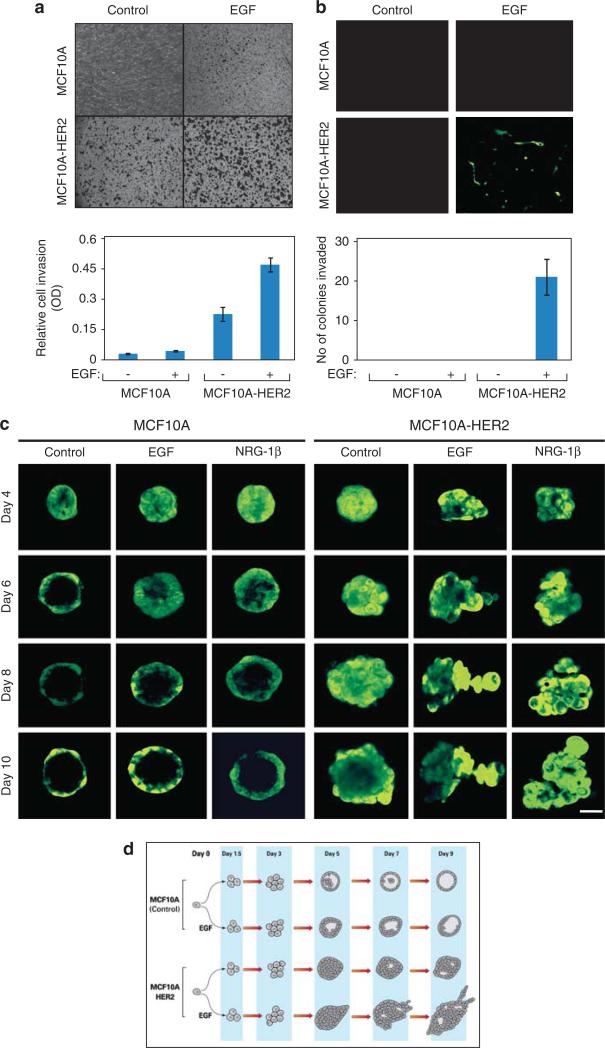
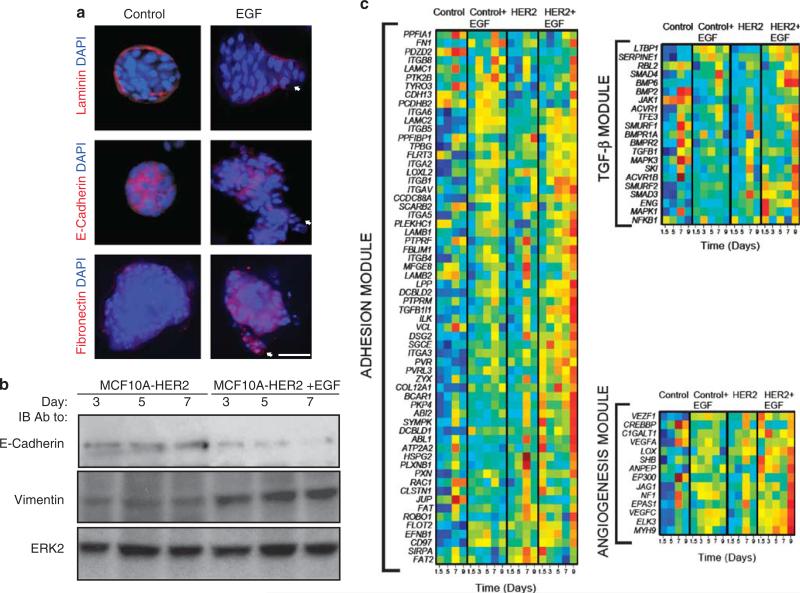
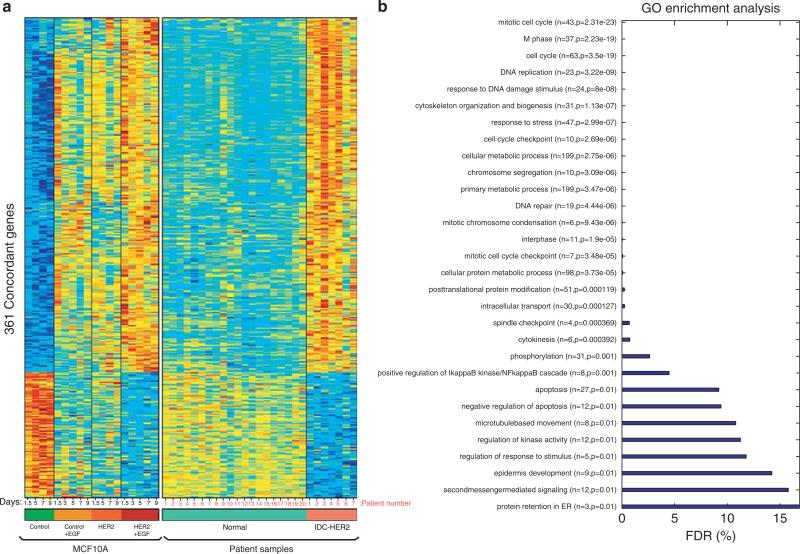
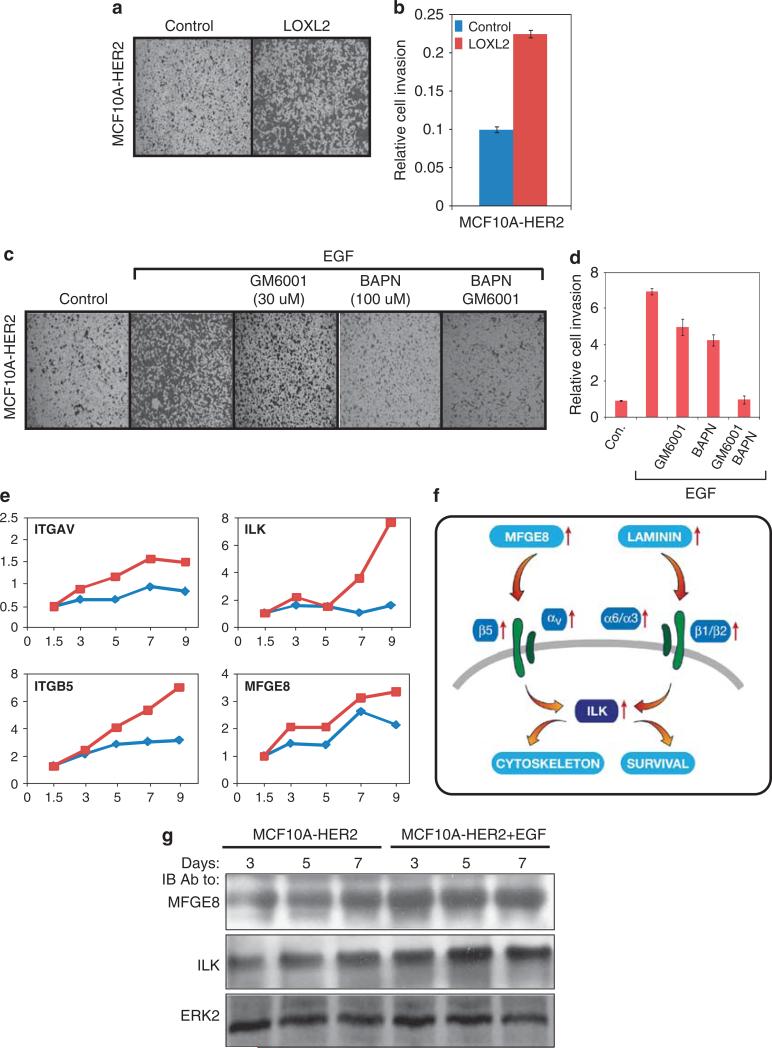
The HER2/neu oncogene encodes a receptor-like tyrosine kinase whose overexpression in breast cancer predicts poor prognosis and resistance to conventional therapies. However, the mechanisms underlying aggressiveness of HER2 (human epidermal growth factor receptor 2)-overexpressing tumors remain incompletely understood. Because it assists epidermal growth factor (EGF) and neuregulin receptors, we overexpressed HER2 in MCF10A mammary cells and applied growth factors. HER2-overexpressing cells grown in extracellular matrix formed filled spheroids, which protruded outgrowths upon growth factor stimulation. Our transcriptome analyses imply a two-hit model for invasive growth: HER2-induced proliferation and evasion from anoikis generate filled structures, which are morphologically and transcriptionally analogous to preinvasive patients' lesions. In the second hit, EGF escalates signaling and transcriptional responses leading to invasive growth. Consistent with clinical relevance, a gene expression signature based on the HER2/EGF-activated transcriptional program can predict poorer prognosis of a subgroup of HER2-overexpressing patients. In conclusion, the integration of a three-dimensional cellular model and clinical data attributes progression of HER2-overexpressing lesions to EGF-like growth factors acting in the context of the tumor's microenvironment.


Figures

Figure 1
Figure 1
HER2 delays intraluminal apoptosis and GFs induce invasive arm formation by MCF10A spheroids grown in extracellular matrix. (a) MCF10A and MCF10A/HER2 monolayers (50 000 cells) were plated on Matrigel-coated Transwell chambers and incubated for 12 h in the presence or absence of EGF (20 ng/ml). Thereafter, the opposite face of the Transwell filter was stained using crystal violet. The lower part presents quantification of the number of cells that migrated to the other side of the filter. (b) MCF10A and MCF10A/HER2 cells were suspended in 5% Matrigel and 2000 cells were plated on a Matrigel-coated Transwell filter separating two compartments of a Transwell chamber. After 18 days of incubation in the absence or presence of EGF, spheroids were removed from the upper face of the filter, whereas cells located on the lower face were observed using fluorescence microscopy. The lower part shows quantification of the number of invading colonies per field. Bars represent s.d. of triplicate determinations. (c) Confocal microscopy images of acini of MCF10A and MCF10A/HER2 cells plated in Matrigel for the indicated times in the absence or presence of EGF or neuregulin (NRG)-1β (each at 20 ng/ml). Each series represents time-lapse images from the same acinus (bar, 50 μm). (d) Flow diagrams of RNA sampling for microarray analyses. The schemes present multicellular structures exhibited by MCF10A and MCF10A/HER2 cells grown in extracellular matrix, in the absence or presence of EGF. RNA was isolated at the indicated time points and used for hybridization to DNA arrays.
Figure 2
Figure 2
Morphological and transcriptional effects of HER2 overexpression and EGF treatment of mammary spheroids. (a) Acini of HER2-overexpressing MCF10A cells were grown for 8 days in Matrigel in the absence or presence of EGF, before immunostaining with 4,6-diamidino-2-phenylindole (DAPI) and with the indicated antibodies (scale bar, 50 μm). (b) Acini of HER2-overexpressing MCF10A cells were grown in the absence or presence of EGF for the indicated time intervals, before immunoblotting (IB) with the indicated antibodies. (c) RNA expression levels of genes whose variation of expression during acinar morphogenesis is different in untreated versus EGF-treated MCF10A/HER2 cells and in MCF10A (control) cells. Expression levels were normalized and the genes grouped according to their known functions: adhesion, BMP/TGFβ signaling and angiogenesis/response to hypoxia.
Figure 3
Figure 3
Transcriptomic similarities of HER2-overexpressing IDC specimens and EGF-treated invasive spheroids of MCF10A/HER2 cells. (a) Heatmaps of 361 concordant genes, which are differentially expressed in MCF10A/HER2 spheroids treated with EGF, in comparison with MCF10A spheroids, either untreated or treated with EGF for increasing time intervals. The status of expression of each concordant gene in IDC and in normal human mammary epithelia is shown in the right part. A threshold of 5% FDR was used. Note that each column represents a time point (MCF10A cells) or a patient (clinical samples). (b) Distribution of the 361 concordant genes according to their GO annotation and the respective FDR values (see Supplementary File 2).
Figure 4
Figure 4
Multicomponent activation of the TGFβ/BMP module of HER2-overexpressing acini upon treatment with EGF. (a) Untreated (blue line) and EGF-treated MCF10A/HER2 cells (red line) were grown in Matrigel. Total RNA was isolated at the indicated time points, subjected to reverse transcription and analyzed by real-time PCR with primers specific to the indicated genes. (b) Schematic presentation of the transcriptionally induced TGFβ/BMP module. Narrow arrows indicate transcriptional upregulation (except for BAMBI, which is downregulated) and P letters symbolize phosphorylation. ACVR, activin receptor; BMPR, BMP receptor. (c) Immunoblot analysis was performed on HER2-overexpressing acini treated without or with EGF for the indicated time intervals, using antibodies to BMPR2 and BAMBI. (d) MCF10A/HER2 cells were grown for 10 days in Matrigel in the presence of EGF. Thereafter, EGF was removed and 24 h later cells were stimulated with BMP2 (10 ng/ml) for the indicated time intervals, before immunoblotting using an antibody specific to the phosphorylated forms of SMAD1, 5 and 8. (e) MCF10A/HER2 cells were transfected with small interfering RNA (siRNA) oligonucleotides specific to SMAD4 (or control siRNA), and grown for 48 h before immunoblotting. (f) MCF10A/HER2 cells were transfected with control siRNA or with SMAD4 siRNA, and 48 h later they were incubated for 12 h in Transwell chambers coated with Matrigel. Cells that invaded into the lower compartment were stained using crystal violet. (g) Quantification of the migration signals of the cells presented in (f).
Figure 5
Figure 5
HER2 overexpression enhances transcriptional induction of an angiogenesis/hypoxia module upon treatment with EGF. (a) Total RNA was subjected to analysis of the indicated genes by PCR, as in Figure 4a. (b) Schematic presentation of the angiogenesis module. Narrow arrows indicate transcriptional upregulation. AREG, amphiregulin. (c) Immunoblot analysis was performed on HER2-overexpressing acini treated without or with EGF for the indicated time intervals, using hypoxia-inducible transcription factor-2α (HIF2α) and LOXL2 antibodies. (d, e) MCF10A/HER2 cells were plated in Matrigel and grown for 4 days in the presence of EGF. Thereafter, the cultures were grown for 8 additional days in the absence or presence of the indicated concentrations of a lysyl oxidase inhibitor, β-aminopropionitrile (BAPN). Capturing of photos and morphometric analyses of 50 acini were performed 8 days later. (f) MCF10A/HER2 cells were plated in Matrigel in the absence or presence of a recombinant LOXL2 enzyme (1 μm), and then incubated for 18 days, before phase microscopy (top) and staining with 4,6-diamidino-2-phenylindole (DAPI) and an anti-Laminin antibody (bottom; bars, 100 μm). White arrows mark outgrowths across the Laminin shell.
Figure 6
Figure 6
LOXL2 and secreted integrin ligands are involved in the enhanced migratory response of HER2-overexpressing cells to EGF. (a, b) MCF10A/HER2 cells (50 000 cells) were plated on type I collagen-coated Transwell chambers and then incubated for 24 h in the absence or presence of recombinant LOXL2 enzyme (1 μm). Cells that invaded into the lower chamber of the Transwell membrane were stained using crystal violet, photographed and relative cell invasion quantified in triplicates. (c, d) MCF10A and MCF10A/HER2 cells (50 000 cells) were plated on type-I collagen-coated Transwell chambers and incubated for 24 h with EGF in the absence or presence of a general matrix metalloproteinase (MMP) inhibitor (GM6001) or a LOX inhibitor (β-aminopropionitrile (BAPN)). Cells that invaded into the lower part of the Transwell chamber were stained using crystal violet, and relative cell invasion was quantified in triplicates. (e) Total RNA was subjected to analysis of the indicated genes by PCR, as in Figure 4a. (f) A scheme showing functional relationships within the upregulated matrix-adhesion module. Narrow red arrows indicate transcriptional upregulation. (g) Immunoblot analysis was performed on HER2-overexpressing acini treated without or with EGF for the indicated time intervals, using MFGE8 or ILK antibodies.
Figure 7
Figure 7
Effects of MFGE8 on invasion of HER2-overexpressing mammary cells. (a) MCF10A and MCF10A/HER2 cells were serum starved for 12 h, stimulated for 10 min with MFGE8 (100 ng/ml) and cell extracts immunoblotted with the indicated antibodies, including an antibody the phosphorylated form of ERK. (b, c) MCF10A/HER2 cells (50 000 cells) were plated on Matrigel-coated Transwell chambers and incubated for 12 h in the absence or presence of EGF (20 ng/ml) and/or MFGE8 (100 ng/ml). Cells that invaded into the lower side of the Transwell chambers were stained using crystal violet, photographed and counted. (c) Quantification of the cell migration data shown in (b). Bars represent s.d. of triplicates. (d) Phase microscopy analysis of MCF10A/HER2 acini plated in Matrigel and grown for 10 days in the absence or presence of EGF (20 ng/ml), ectopic MFGE8 (10 ng/ml) or a blocking antibody to integrin αV (bar, 50 μm). (e) Monolayers of MCF10A/HER2 cells were stably infected with short hairpin RNA (shRNA) particles, either control (C) or shRNA targeting MFGE8 (clones 74, 77 and 78). Cell clones were tested for MFGE8 expression using immunoblotting. (f, g) MCF10A/HER2 cells expressing the indicated shRNAs were cultured for 10 days in Matrigel. Phase contrast micrographs are shown (bar, 50 μm), along with morphometric analysis of acini. Shown are averages±s.d. values of triplicates.
Figure 8
Figure 8
An invasive signature predicts survival of HER2-overexpressing patients. (a) Kaplan–Meier analyses of RFS of breast cancer patients grouped into three major subtypes, according to ER and HER2 status. Nine breast cancer microarray data sets were used as a training set (upper row), along with an independent test set (lower row; VDX data set; Supplementary File 3, sheet 1). Tumors were stratified according to high (red), medium (green) or low (blue) expression of the HER2-associated invasive signature comprising 25 genes (Supplementary File 3, sheet 3). Hazard ratios (HRs; average and 95% confidence interval), patient numbers and P-values are indicated. Note that the prognostic value of the HER2/EGF signature is confined to the HER2 subtype. (b) Forest plots summarizing HRs of relapse in the test set of breast cancer patients (VDX data set). The area of each square and its arms respectively represent the number of patients and the 95% confidence intervals corresponding to the listed clinical parameters (top part) and published gene signatures (lower part), including the HER2/EGF signature (highlighted bar) we describe herein. Note that the red boxes indicate statistical significance and that the number of relapse events in low-grade ER/HER tumors was too small for analysis.

References

    1. Akiri G, Sabo E, Dafni H, Vadasz Z, Kartvelishvily Y, Gan N, et al. Lysyl oxidase-related protein-1 promotes tumor fibrosis and tumor progression in vivo. Cancer Res. 2003;63:1657–1666. - PubMed
    1. Aranda V, Haire T, Nolan ME, Calarco JP, Rosenberg AZ, Fawcett JP, et al. Par6-aPKC uncouples ErbB2 induced disruption of polarized epithelial organization from proliferation control. Nat Cell Biol. 2006;8:1235–1245. - PubMed
    1. Balleine RL, Webster LR, Davis S, Salisbury EL, Palazzo JP, Schwartz GF, et al. Molecular grading of ductal carcinoma in situ of the breast. Clin Cancer Res. 2008;14:8244–8252. - PMC - PubMed
    1. Chen DT, Nasir A, Culhane A, Venkataramu C, Fulp W, Rubio R, et al. Proliferative genes dominate malignancy-risk gene signature in histologically-normal breast tissue. Breast Cancer Res Treat. 2010;119:335–346. - PMC - PubMed
    1. Collins NL, Reginato MJ, Paulus JK, Sgroi DC, Labaer J, Brugge JS. G1/S cell cycle arrest provides anoikis resistance through Erk-mediated Bim suppression. Mol Cell Biol. 2005;25:5282–5291. - PMC - PubMed

Publication types

MeSH terms

Substances