. 2012 May;19(5):743-55.
doi: 10.1038/cdd.2011.172. Epub 2011 Dec 2.

Culture of human mesenchymal stem cells at low oxygen tension improves growth and genetic stability by activating glycolysis

Affiliations

Culture of human mesenchymal stem cells at low oxygen tension improves growth and genetic stability by activating glycolysis

J C Estrada et al. Cell Death Differ. 2012 May.

Abstract

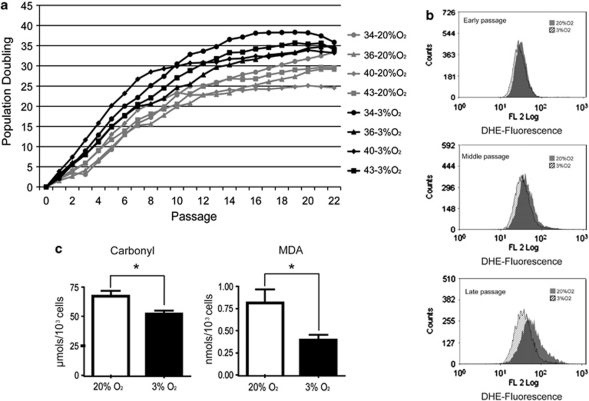
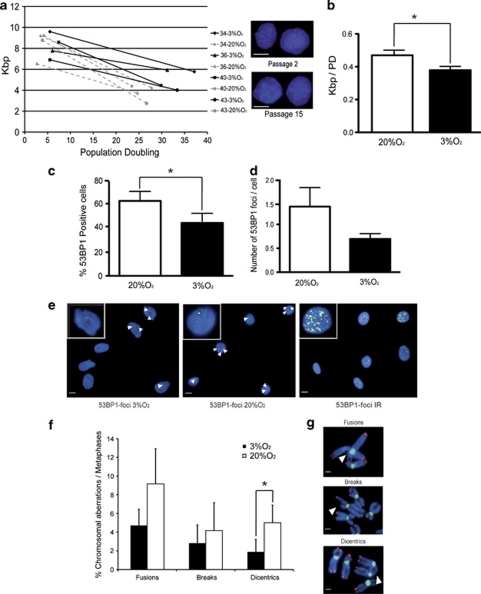
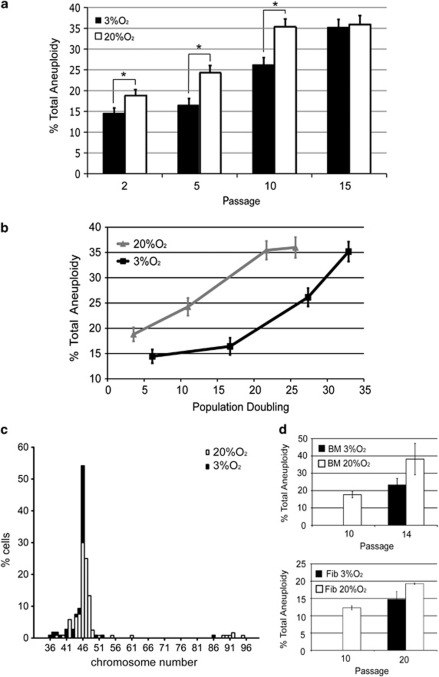
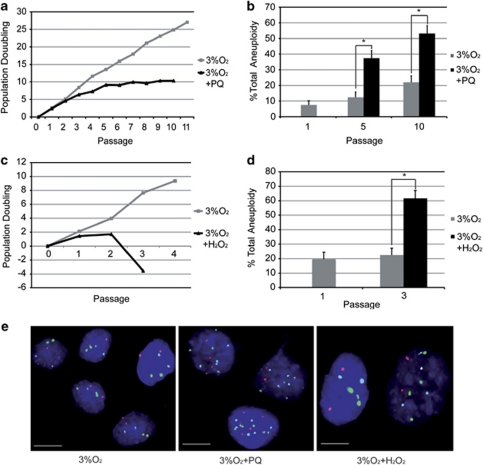
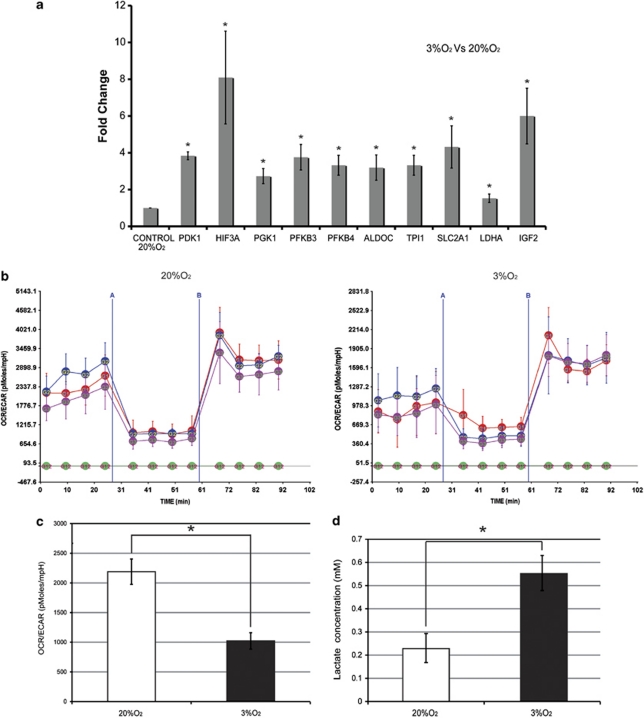
Expansion of human stem cells before cell therapy is typically performed at 20% O(2). Growth in these pro-oxidative conditions can lead to oxidative stress and genetic instability. Here, we demonstrate that culture of human mesenchymal stem cells at lower, physiological O(2) concentrations significantly increases lifespan, limiting oxidative stress, DNA damage, telomere shortening and chromosomal aberrations. Our gene expression and bioenergetic data strongly suggest that growth at reduced oxygen tensions favors a natural metabolic state of increased glycolysis and reduced oxidative phosphorylation. We propose that this balance is disturbed at 20% O(2), resulting in abnormally increased levels of oxidative stress. These observations indicate that bioenergetic pathways are intertwined with the control of lifespan and decisively influence the genetic stability of human primary stem cells. We conclude that stem cells for human therapy should be grown under low oxygen conditions to increase biosafety.


Figures

Figure 1
Figure 1
Effects of physiological oxygen concentration on growth and oxidative stress levels in hMSCs. (a) Growth curves of four independent hMSC primary cell lines (isolates 34, 36, 40 and 43) cultured at 3% O2 (black lines) and 20% O2 (gray lines). Growth of hMSC at 3% O2 was significantly higher from passage 2 onward; at both O2 concentrations, senescence was reached at about passage 15. (b) Flow cytometry detection of superoxide (DHE-derived fluorescence) in hMSC cultured at 3% O2 (hatched black histogram) and 20% O2 (gray histogram) at early (passage <5), middle (passages 5–10) and late passage (passage >10). For a given time in culture, superoxide levels were higher in cells grown under ‘standard' (20% O2) conditions, and ROS appear to increase with passage at both oxygen concentrations. Representative histograms from one cell line are shown (n=4). (c) Levels of protein carbonyls and MDA in hMSC lines grown at 20% O2 (white bars) and at 3% O2 (black bars). Culture at 3% O2 results in significantly lower levels of these oxidative stress-derived products (*P<0.05). Experiments were performed in triplicate with the four independent lines. Data are means±S.E.M.
Figure 2
Figure 2
Supra-physiological oxygen tension increases DSBs and chromosomal aberrations in hMSCs. (a) Plot of telomere length against PD in interphase hMSC. Telomere length was measured by Q-FISH at passages 2 and 15. Thin dotted and solid lines represent telomere shortening in hMSC grown at 20% O2 and 3% O2, respectively. Color insets show representative images of cells at passage 2 and passage 15 hybridized with the telomeric probe (red). Scale bars, 10 μm. (b) Quantification of telomere length reduction as kbp per PD. The quantification shows a significant reduction of telomere shortening at 3% O2 (*P=0.016). Telomere fluorescence was converted to kbp by comparison with fibroblast lines expressed known amounts of TIN2 and TIN2–13. (c) Quantification of 53BP1-positive cells grown at 3% O2 and 20% O2. A significant reduction was appreciated at 3% O2 (*P=0.013). (d) Quantification of 53BP1 foci per nucleus, showing the trend in the reduction of DSB per cell in cultures grown at 3% O2; in all cases the cells were grown for 18±2 PD (e) Examples of cells grown at 3% O2 and 20% O2 stained with 53BP1 (yellow) to mark DSB. Irradiated cells (10 Gy) are shown as a positive control; negative controls show no signal at this same time exposure. Nuclei are counterstained with DAPI (blue). The white arrows mark individual foci. Insets in the upper left corner show a magnification of representative nuclei from each condition. Scale bars, 10 μm. (f) Quantification of structural chromosomal aberrations in metaphase cells from hMSC grown at 3% O2 (black bars) and 20% O2 (white bars); 3% O2 reduced the incidence of chromosomal abnormalities, including a significant reduction in dicentric chromosomes (*P=0.049). (g) Examples of chromosomal aberrations in cells processed for FISH with centromeric (green) and telomeric (red) PNA probes. Scale bars, 1 μm. Experiments were performed in triplicate with the four independent lines. Data are means±S.E.M.
Figure 3
Figure 3
Long-term exposure to supra-physiological oxygen tension promotes aneuploidy in telomerase-negative hMSCs. (a) Mean aneuploidy (%) scored in 100–200 nuclei per hMSC cell line at 3% O2 (black bars) and 20% O2 (white bars). Aneuploidy was detected by FISH with centromeric probes for chromosomes 8, 11 and 17. Growth at 3% O2 significantly reduced the incidence of aneuploidy during passages 2–10 (*P<0.049). (b) Aneuploidy levels plotted against PD; hMSC grown at low oxygen are significantly more stable per cell division. Experiments were performed in triplicate with the four independent lines. Data are means±S.E.M. (c) Frequency histogram of chromosome counts from hMSC expanded for 18±2 PD (n=106–120). White bars represent metaphases from cells grown at 20% O2; black bars represent metaphases from cells grown at 3% O2. Chromosome numbers are as indicated. (d) Average levels of aneuploidy of two human fibroblast cell lines (passages 10 and 20) and two human BM-MSC lines (passages 10 and 14) at 20% and 3% O2. Aneuploidy was assessed by interphase FISH using Centromere Evaluation Probe (CEP) probes for chromosomes 8, 11 and 17
Figure 4
Figure 4
Exogenous sources of ROS cause growth defects and genetic instability in hMSCs. (a) Growth dynamics of an hMSC line cultured at 3% O2 with (black) and without (gray) treatment with 40 μM PQ as a source of ROS, showing a decrease in growth after PQ treatment. (b) Aneuploidy levels in control and PQ-treated cells. PQ treatment significantly increased aneuploidy at passages 5 (*P<0.050) and 10 (*P<0.050). (c) Growth dynamics of an hMSC line grown at 3% O2 with (black) or without (gray) treatment with hydrogen peroxide (H2O2, 100 μM) as a source of ROS, showing decreased growth and cell death after H2O2 treatment. (d) Aneuploidy levels in control and H2O2-treated cells. H2O2 treatment significantly increased aneuploidy at passage 3 (*P<0.050). (e) Representative FISH images of cells grown at 3% O2: left, controls; middle, PQ treated; right. H2O2 treated. Scale bars, 10 μm. Cells were hybridized with Centromere Evaluation Probe (CEP) probes for chromosomes 8 (red signal), 11 (green) and 17 (light blue). In the aneuploidy experiments, the fraction of aneuploid cells was calculated for each condition, and data were analyzed with Fisher's exact test for two binomials
Figure 5
Figure 5
Culture of hMSC at physiological oxygen tension increases glycolytic activity and reduces oxygen consumption. (a) RT-PCR analysis (Taqman) of pyruvate dehydrogenase kinase, isozyme 1 (pdk1); hif-3a; phosphoglycerate kinase 1 (pgk1); 6-phosphofructo-2-kinase/fructose-2,6-biphosphatase 3 (pfkfb3); 6-phosphofructo-2-kinase/fructose-2,6-biphosphatase 4, (pfkfb4); aldolase C, fructose-bisphosphate (aldoc); triosephosphate isomerase 1 (tpi1); solute carrier family 2 (facilitated glucose transporter), member 1 (Scl2a1); lactate dehydrogenase A (ldha); and insulin-like growth factor 2 (igf2). Expression is presented relative to the level in cells grown at 20% O2. Experiments were performed in triplicate with the four independent lines. Data are means±S.E.M. In all cases, the data were statistically significant (*P<0.050). (b) OCR/ECAR curves for three hMSC lines exposed to 3% O2 and 20% O2. Curves were generated using a FX96 Flux Analyzer and Seahorse technology (see Materials and Methods section). The first four points on the graphs indicate the basal OCR/ECAR ratio (expressed in pmoles/mpH); the green line indicates background correction of the blank. Oligomicin was added at time point A and the mitochondrial uncoupler at time point B. (c) Average OCR/ECAR ratios (pmoles/mpH) for three hMSC lines grown at 3% O2 and 20% O2 (*P<0.050). Bars represent means±S.E.M; experiments were performed with eight replicates for each time point. (d) Intracellular lactate concentration in hMSC grown at 3% O2 and 20% O2. Cells cultured at 3% O2 contained more lactate than cells cultured at 20% O2 (*P<0.050). Experiments were performed in triplicate with the four independent lines. Data are means±S.E.M. The color reproduction of this figure is available at the Cell Death and Differentiation journal online

References

    1. Siegel G, Schafer R, Dazzi F. The immunosuppressive properties of mesenchymal stem cells. Transplantation. 2009;87 (9 Suppl:S45–S49. - PubMed
    1. Miyahara Y, Nagaya N, Kataoka M, Yanagawa B, Tanaka K, Hao H, et al. Monolayered mesenchymal stem cells repair scarred myocardium after myocardial infarction. Nat Med. 2006;12:459–465. - PubMed
    1. Vaupel P, Okunieff P, Neuringer LJ. Blood flow, tissue oxygenation, pH distribution, and energy metabolism of murine mammary adenocarcinomas during growth. Adv Exp Med Biol. 1989;248:835–845. - PubMed
    1. Fischer B, Bavister BD. Oxygen tension in the oviduct and uterus of rhesus monkeys, hamsters and rabbits. J Reprod Fertil. 1993;99:673–679. - PubMed
    1. Parrinello S, Samper E, Krtolica A, Goldstein J, Melov S, Campisi J. Oxygen sensitivity severely limits the replicative lifespan of murine fibroblasts. Nat Cell Biol. 2003;5:741–747. - PMC - PubMed

Publication types