

Body mass index correlates negatively with white matter integrity in the fornix and corpus callosum: a diffusion tensor imaging study
- PMID: 22139809
- PMCID: PMC3314715
- DOI: 10.1002/hbm.21491
Body mass index correlates negatively with white matter integrity in the fornix and corpus callosum: a diffusion tensor imaging study
Abstract
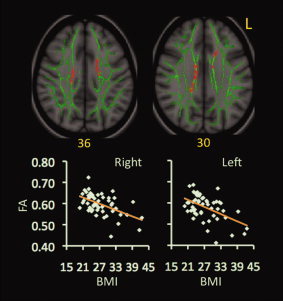
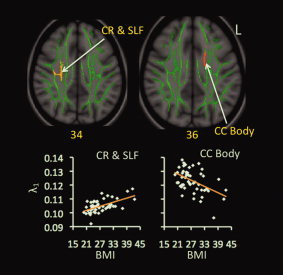
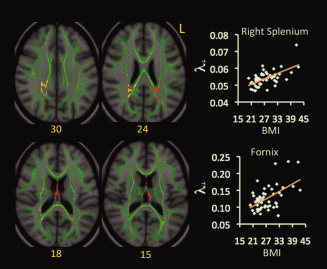
Overweight or obese body habitus is associated with cognitive deficits, impaired brain function, gray matter atrophy, and white matter (WM) hyperintensities. However, few diffusion tensor imaging (DTI) studies have assessed WM integrity in relation to overweight or obese status. This study assessed relationships between body mass index (BMI) and values of DTI parameters among 51 normal weight (lean), overweight, and obese participants who were otherwise healthy. BMI correlated negatively with fractional anisotropy and axial eigenvalues (λ(1)) in the body of corpus callosum (CC), positively with mean diffusivity and radial eigenvalues (See figure in text) in the fornix and splenium of CC, and positively with λ(1) in the right corona radiata (CR) and superior longitudinal fasciculus (SLF). These data indicate that BMI correlates negatively with WM integrity in the fornix and CC. Furthermore, the different patterns of BMI-related differences in DTI parameters at the fornix, body, and splenium of the CC, and the right CR and SLF suggest that different biological processes may underlie BMI-related impairments of WM integrity in different brain regions.
Copyright © 2011 Wiley Periodicals, Inc.
Figures

Similar articles
-
Obesity is associated with reduced white matter integrity in otherwise healthy adults.Obesity (Silver Spring). 2011 Mar;19(3):500-4. doi: 10.1038/oby.2010.312. Epub 2010 Dec 23. Obesity (Silver Spring). 2011. PMID: 21183934
-
White matter integrity is reduced in bulimia nervosa.Int J Eat Disord. 2013 Apr;46(3):264-73. doi: 10.1002/eat.22083. Epub 2013 Jan 28. Int J Eat Disord. 2013. PMID: 23354827 Free PMC article.
-
Compromised white matter integrity in obesity.Obes Rev. 2015 Apr;16(4):273-81. doi: 10.1111/obr.12248. Epub 2015 Feb 10. Obes Rev. 2015. PMID: 25676886 Review.
-
White matter integrity disparities between normal-weight and overweight/obese adolescents: an automated fiber quantification tractography study.Brain Imaging Behav. 2020 Feb;14(1):308-319. doi: 10.1007/s11682-019-00036-4. Brain Imaging Behav. 2020. PMID: 30719618
-
The role of diffusion tensor imaging and fractional anisotropy in the evaluation of patients with idiopathic normal pressure hydrocephalus: a literature review.Neurosurg Focus. 2016 Sep;41(3):E12. doi: 10.3171/2016.6.FOCUS16192. Neurosurg Focus. 2016. PMID: 27581308 Review.
Cited by
-
Patterns of brain structural connectivity differentiate normal weight from overweight subjects.Neuroimage Clin. 2015 Jan 13;7:506-17. doi: 10.1016/j.nicl.2015.01.005. eCollection 2015. Neuroimage Clin. 2015. PMID: 25737959 Free PMC article.
-
Biological contributions to addictions in adolescents and adults: prevention, treatment, and policy implications.J Adolesc Health. 2013 Feb;52(2 Suppl 2):S22-32. doi: 10.1016/j.jadohealth.2012.05.007. J Adolesc Health. 2013. PMID: 23332567 Free PMC article. Review.
-
Extended and replicated white matter changes in obesity: Voxel-based and region of interest meta-analyses of diffusion tensor imaging studies.Front Nutr. 2023 Mar 7;10:1108360. doi: 10.3389/fnut.2023.1108360. eCollection 2023. Front Nutr. 2023. PMID: 36960197 Free PMC article.
-
Preserved white matter microstructure in adolescent patients with atypical anorexia nervosa.Int J Eat Disord. 2019 Feb;52(2):166-174. doi: 10.1002/eat.23012. Epub 2019 Jan 24. Int J Eat Disord. 2019. PMID: 30676658 Free PMC article.
-
White matter changes associated with antipsychotic treatment in first-episode psychosis.Neuropsychopharmacology. 2014 May;39(6):1324-31. doi: 10.1038/npp.2013.288. Epub 2013 Oct 16. Neuropsychopharmacology. 2014. PMID: 24549105 Free PMC article. Clinical Trial.
References
-
- Anan F, Masaki T, Eto T, Iwao T, Shimomura T, Umeno Y, Eshima N, Saikawa T, Yoshimatsu H. ( 2009): Visceral fat accumulation is a significant risk factor for white matter lesions in Japanese type 2 diabetic patients. Eur J Clin Invest 39: 368–374. - PubMed
-
- Assaf Y, Pasternak O ( 2008): Diffusion tensor imaging (DTI)‐based white matter mapping in brain research: a review. J Mol Neurosci 34: 51–61. - PubMed
Publication types
MeSH terms
Grants and funding
LinkOut - more resources
Full Text Sources
Medical
