. 2012 Jan 20;287(4):2863-76.
doi: 10.1074/jbc.M111.307926. Epub 2011 Dec 2.

Gene dose influences cellular and calcium channel dysregulation in heterozygous and homozygous T4826I-RYR1 malignant hyperthermia-susceptible muscle

Affiliations

Gene dose influences cellular and calcium channel dysregulation in heterozygous and homozygous T4826I-RYR1 malignant hyperthermia-susceptible muscle

Genaro C Barrientos et al. J Biol Chem. .

Abstract

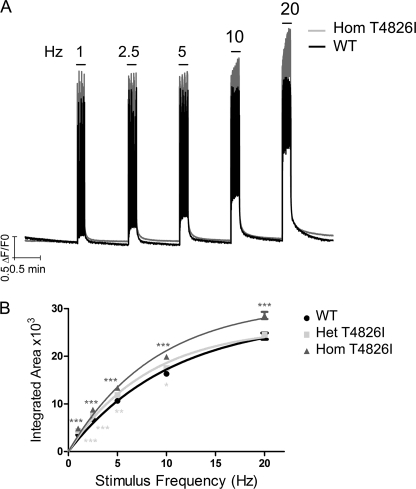
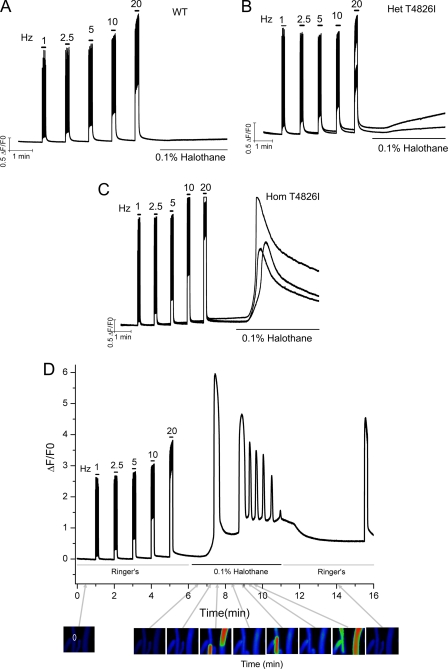
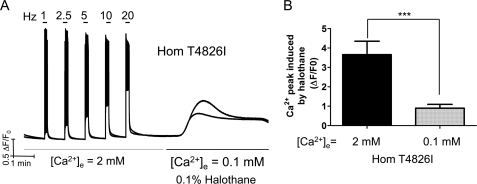
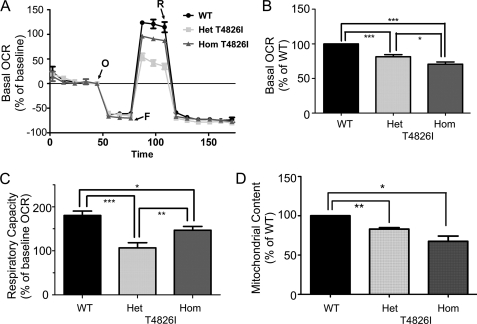
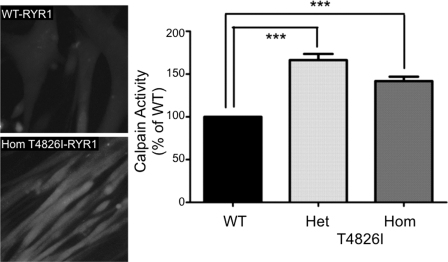
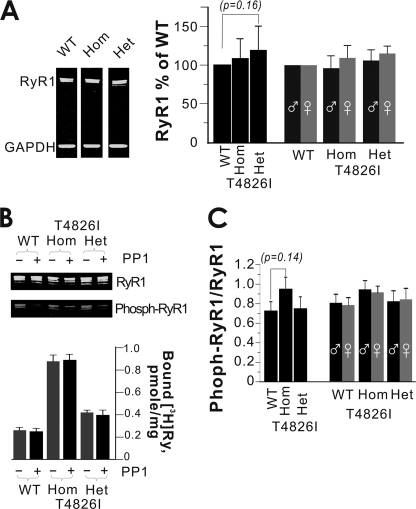
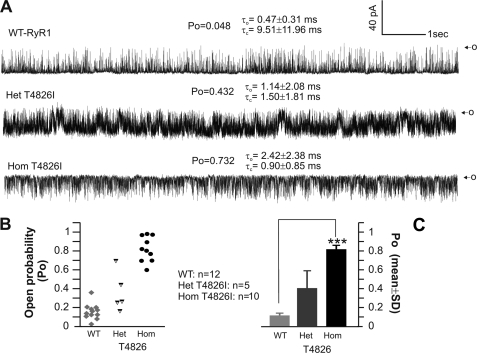
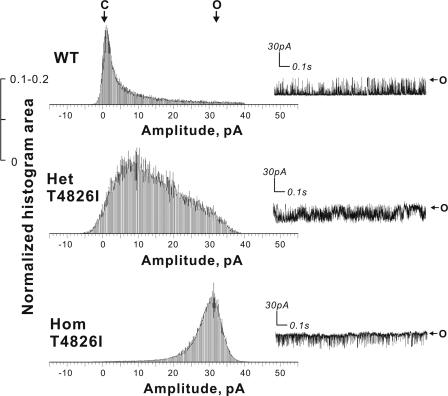
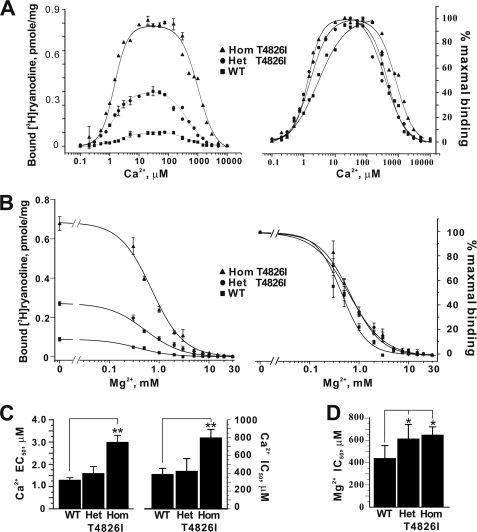
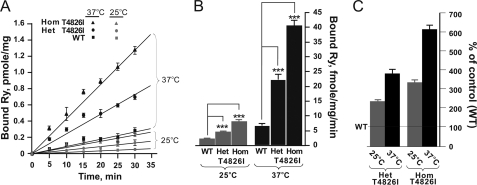
Malignant hyperthermia susceptibility (MHS) is primarily conferred by mutations within ryanodine receptor type 1 (RYR1). Here we address how the MHS mutation T4826I within the S4-S5 linker influences excitation-contraction coupling and resting myoplasmic Ca(2+) concentration ([Ca(2+)](rest)) in flexor digitorum brevis (FDB) and vastus lateralis prepared from heterozygous (Het) and homozygous (Hom) T4826I-RYR1 knock-in mice (Yuen, B. T., Boncompagni, S., Feng, W., Yang, T., Lopez, J. R., Matthaei, K. I., Goth, S. R., Protasi, F., Franzini-Armstrong, C., Allen, P. D., and Pessah, I. N. (2011) FASEB J. doi:22131268). FDB responses to electrical stimuli and acute halothane (0.1%, v/v) exposure showed a rank order of Hom ≫ Het ≫ WT. Release of Ca(2+) from the sarcoplasmic reticulum and Ca(2+) entry contributed to halothane-triggered increases in [Ca(2+)](rest) in Hom FDBs and elicited pronounced Ca(2+) oscillations in ∼30% of FDBs tested. Genotype contributed significantly elevated [Ca(2+)](rest) (Hom > Het > WT) measured in vivo using ion-selective microelectrodes. Het and Hom oxygen consumption rates measured in intact myotubes using the Seahorse Bioscience (Billerica, MA) flux analyzer and mitochondrial content measured with MitoTracker were lower than WT, whereas total cellular calpain activity was higher than WT. Muscle membranes did not differ in RYR1 expression nor in Ser(2844) phosphorylation among the genotypes. Single channel analysis showed highly divergent gating behavior with Hom and WT favoring open and closed states, respectively, whereas Het exhibited heterogeneous gating behaviors. [(3)H]Ryanodine binding analysis revealed a gene dose influence on binding density and regulation by Ca(2+), Mg(2+), and temperature. Pronounced abnormalities inherent in T4826I-RYR1 channels confer MHS and promote basal disturbances of excitation-contraction coupling, [Ca(2+)](rest), and oxygen consumption rates. Considering that both Het and Hom T4826I-RYR1 mice are viable, the remarkable isolated single channel dysfunction mediated through this mutation in S4-S5 cytoplasmic linker must be highly regulated in vivo.


Figures

FIGURE 1.
FIGURE 1.
T4826I knock-in fibers display an enhanced frequency response compared with the WT fibers. Fibers dissociated from WT-RYR1, Het T4826I-RYR1, or Hom T4826I-RYR1 mice were loaded with Fluo-4 and tested for electrically evoked EC coupling in the Ca2+-replete external buffer ([Ca2+]e = 2 mm). A, representative responses of FDB to electrical pulse trains applied at 1–20 Hz for a 10-s duration isolated from WT (black trace) and Hom T4826I-RYR1 (gray trace) mice. For clarity, the Het T4826I-RYR1 trace is not superimposed on the traces. B, summary data for all three genotypes relating integrated areas of the Ca2+ transient at each stimulus frequency. WT-RYR1 results are mean data ± S.E. from n = 162 fibers from five animals; Het results are from n = 180 fibers from three animals, and Hom results are from n = 203 fibers from four animals. ***, p < 0.001 compared with WT. **, p < 0.01 compared with WT. *, p < 0.05 compared with WT.
FIGURE 2.
FIGURE 2.
Het and Hom T4826I-RYR1 FDB fibers show heightened sensitivity to halothane. Fibers dissociated from WT-RYR1 (A), Het T4826I-RYR1 (B), or Hom T4826I-RYR1 (C) mice were loaded with Fluo-4 and tested for electrically evoked EC coupling in the Ca2+ replete external buffer ([Ca2+]e = 2 mm). Fibers were then challenged with halothane dissolved in the same external buffer ([Ca2+]e = 2 mm) in the absence of electrical stimuli. A–C, traces from individual fibers from each genotype. Similar results were obtained from 39 and 28 Het and Hom fibers, respectively, from three independent fiber isolations for each genotype. D, halothane can produce marked elevation in base-line Ca2+ and regenerative Ca2+ waves that were observed in eight of 28 Hom T4826I-RYR1 fibers tested. Oscillations abated, and the base line gradually was restored upon removal of halothane by perfusion. Halothane-triggered oscillations were not observed in fibers isolated from either WT-RYR1 or Het T4826I-RYR1 mice.
FIGURE 3.
FIGURE 3.
[Ca2+]e contributes to halothane-triggered peak Ca2+ rise in Hom T4826I-RYR1 FDB. Fibers dissociated from WT-RYR1 and Hom T4826I-RYR1 mice were loaded with Fluo-4 and tested for electrically evoked EC coupling in Ca2+-replete external buffer ([Ca2+]e = 2 mm). Fibers were then challenged with halothane in the same external buffer whose [Ca2+]e was reduced with EGTA ([Ca2+]e = 0.1 mm). A, representative traces from two individual Hom T4826I-RYR1 fibers. B, comparison of the halothane-triggered peak Ca2+ amplitude (mean ± S.E. (error bars)) for Hom T4826I-RYR1 fibers with [Ca2+]e = 2 mm (0.9 ± 0.2; n = 8) and [Ca2+]e = 0.1 mm (3.7 ± 0.7; n = 4) (p < 0.001).
FIGURE 4.
FIGURE 4.
Myotubes isolated from T4826I-RYR1 mice have impaired oxygen consumption and respiratory capacity and lower mitochondrial content. The basal OCR and RC were evaluated before and after sequential injection of oligomycin, FCCP, and rotenone into the wells of a Seahorse Biosciences flux analyzer. WT, Het, and Hom 4826I-RYR1 myoblasts were plated at 30,000 cells/well and differentiated to myotubes 3 days prior to measuring OCR and RC. A representative experiment is shown in A, where OCR was measured simultaneously from the three genotypes before and after sequential injection of mitochondrial inhibitors (oligomycin (O), FCCP (F), and rotenone (R)). Each trace represents the mean ± S.E. (error bars) OCR of 5 wells/genotype. The values were normalized to basal OCR (before oligomycin injection). B, mean ± S.E. OCR obtained from 25 wells from four independent experiments, indicating that Het and Hom T4826I-RYR1 myotubes have significantly lower basal OCR and RC compared with WT myotubes. The mean ± S.E. basal OCR values were Het = 81.4 ± 3.2 (p < 0.01) and Hom = 70.8 ± 3.1% (p < 0.01) of WT. C, RC measured as OCR after injecting FCCP to uncouple electron transport (after FCCP in A). The mean ± S.E. RC values were significantly lower in Het and Hom T4826I-RYR1 compared with WT (59.8 ± 11.3% (p = 0.034) and 64.8 ± 8.7% (p = 0.026), respectively). D, intact myotubes were loaded with 100 nm MitoTracker Green, and the cellular fluorescence was quantitatively measured as described under “Experimental Procedures.” The fluorescence values were normalized to protein concentration. Each bar represents the mean ± S.E. of n = 4 independent experiments, each performed with five replicates. **, p < 0.01; *, p < 0.05.
FIGURE 5.
FIGURE 5.
T4826I mutants show enhanced intracellular calpain activity. A, myotube peptidase activity was measured quantitatively using the synthetic substrate t-BOC, which is cleaved by intracellular calpain to a fluorescent product using Quantview as described under “Experimental Procedures.” B, calpain activity summarized, where each bar represents the mean ± S.E. (error bars) of 100 myotubes/genotype relative to WT (***, p < 0.001).
FIGURE 6.
FIGURE 6.
No significant differences in total RYR1 expression or phosphorylation of Ser2844-RYR1 in preparations from WT, Het, or Hom T4826I-RYR1 mice. A, representative Western blot showing the expression of RYR1 probed with monoclonal 34C (total RYR1; green channel). The bar graph shows mean ± S.E. (error bars) densitometry results for n = 17 blots from seven membrane preparations where muscle was pooled from males and females. No differences among the three genotypes for total RYR1 protein expression were detected. In separate preparations, skeletal muscle from males and females were collected, and membranes prepared and blotted separately. Bar graphs show mean ± S.E. densitometry results for n = 6 blots from two separate membrane preparations. No differences between gender or among genotypes for total RYR1 protein expression were detected. B, representative Western blot showing Ser(P)2844-RYR1 levels before and after treatment with PP1. The bottom panel summarizes the amount of specific [3H]Ry binding to muscle membranes isolated from WT, Het, and Hom T4826I mice with and without PP1 treatment. PP1 effectively dephosphorylates Ser(P)2844-RYR1 but has no effect on [3H]Ry binding levels, which remain significantly higher in preparations from Het and Hom mutants (also see Fig. 9). C, densitometry shows that the relative levels of Ser(P)2844-RYR1/total RYR1 did not significantly differ among the three genotypes (mean ± S.E. for n = 16 blots from five membrane preparations) or between genders (mean ± S.E. for n = 6 blots from two membrane preparations).
FIGURE 7.
FIGURE 7.
Hom T4826I-RYR1 channels are uniformly hyperactive in BLM. Single channels were incorporated in BLM in the presence of 1 μm free Ca2+, 2 mm Na2ATP in cis chamber, 100 μm Ca2+ in trans. A, representative 10-s continuous recording for a WT-RYR1 (top trace), a Het T4826I-RYR1 (middle trace), and Hom T4826I-RYR1 channel currents (bottom trace) with their corresponding Po, τo, and τc. O, maximal single channel current amplitude. B and C, summary of Po data for n = 13 WT-RYR1, n = 5 Het T4826I-RYR1, and n = 10 Hom T4826I-RYR1 channels (B, scatter plot; C, mean ± S.D. (error bars)). Channels were reconstituted from three different paired skeletal muscle membrane preparations. ***, p < 0.0001.
FIGURE 8.
FIGURE 8.
Het and Hom T4826I-RYR1 channels show distinct gating behaviors. Representative channel current amplitude histograms were obtained for WT-RYR1, Het, and Hom T4826I-RYR1 under identical conditions described in the legend to Fig. 7. WT-RYR1 and T4826I-RYR1 channels show uniform current amplitudes that strongly favor the closed and full open channel states, respectively. Het T4826I-RYR1 channels exhibited broader intermediate states consistent with random association of WT-T4826I RYR1 monomers to form chimeric tetrameric channels. The insets show 1.5 s of representative current trace for each genotype.
FIGURE 9.
FIGURE 9.
WT, Het, and Hom T4826I-RYR1 differ in their modulation by Ca2+ and Mg2+. Equilibrium [3H]Ry binding (2 nm) was performed at 37 °C for 3 h in the presence of defined [Ca2+] (100 nm to 10 mm) (A) or 5 μm Ca2+ + Mg2+ (0–30 mm) (B). EC50 and IC50 values obtained from curve fit of Ca2+ activation/inactivation and Mg2+ inhibition are plotted in C and D, respectively. The data are from 3–4 different skeletal muscle membrane preparations (100 μg/ml) (n = 9–11 (A and C); n = 8–9 (B and D)). The significance of difference is denoted as follows: *, p < 0.05; **, p < 0.01.
FIGURE 10.
FIGURE 10.
WT, Het, and Hom T4826I-RYR1 differ in sensitivity to temperature. Initial binding of 5 nm [3H]Ry to 100 μg/ml skeletal muscle membranes were performed at 25 or 37 °C in the presence of 5 μm free Ca2+ and determined at 5, 10, 15, 20, 25, and 30 min. A, the results are plotted as rate lines. B, The initial rates were calculated, and kobs values are plotted as bar graphs. C, the differences in kobs measured with Het and Hom T4826I-RYR1 are plotted relative to kobs WT-RYR1. Statistical analyses indicate significant difference in temperature sensitivity among the three genotypes (***, p < 0.001; n = 4 from two different skeletal muscle membrane preparations).

References

    1. Yuen B. T., Boncompagni S., Feng W., Yang T., Lopez J. R., Matthaei K. I., Goth S. R., Protasi F., Franzini-Armstrong C., Allen P. D., Pessah I. N. (2011) Mice expressing T4826I-RYR1 are viable but exhibit sex- and genotype-dependent susceptibility to malignant hyperthermia and muscle damage. FASEB J. doi:22131268 - PMC - PubMed
    1. Zhou J., Allen P. D., Pessah I. N., Naguib M. (2010) Neuromuscular Disorders and Malignant Hyperthermia. in Miller's Anesthesia (Miller R. D., ed) pp. 1171–1196, 7th Ed., Churchill Livingstone, Philadelphia, PA
    1. Litman R. S., Rosenberg H. (2005) Malignant hyperthermia. Update on susceptibility testing. JAMA 293, 2918–2924 - PubMed
    1. Robinson R., Carpenter D., Shaw M. A., Halsall J., Hopkins P. (2006) Mutations in RYR1 in malignant hyperthermia and central core disease. Hum. Mutat. 27, 977–989 - PubMed
    1. Brady J. E., Sun L. S., Rosenberg H., Li G. (2009) Prevalence of malignant hyperthermia due to anesthesia in New York State, 2001–2005. Anesth. Analg. 109, 1162–1166 - PubMed

Publication types

Substances