. 2012 Jan 27;287(5):2984-95.
doi: 10.1074/jbc.M111.309062. Epub 2011 Dec 4.

Global profiling of reactive oxygen and nitrogen species in biological systems: high-throughput real-time analyses

Affiliations

Global profiling of reactive oxygen and nitrogen species in biological systems: high-throughput real-time analyses

Jacek Zielonka et al. J Biol Chem. .

Abstract

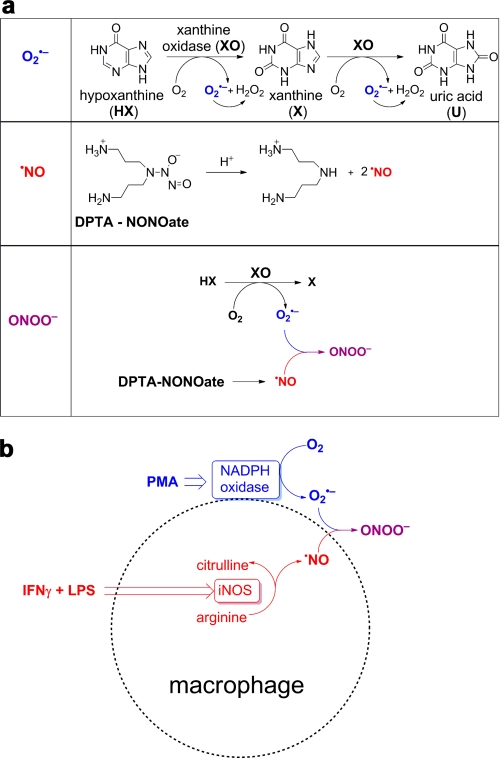
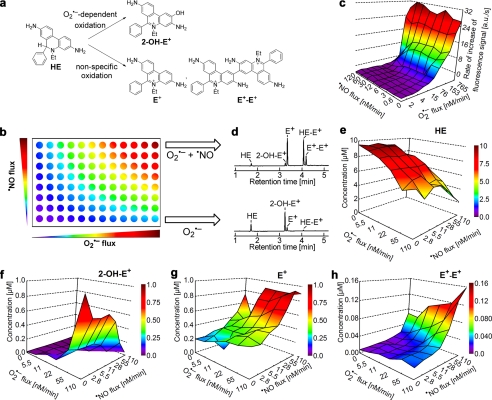
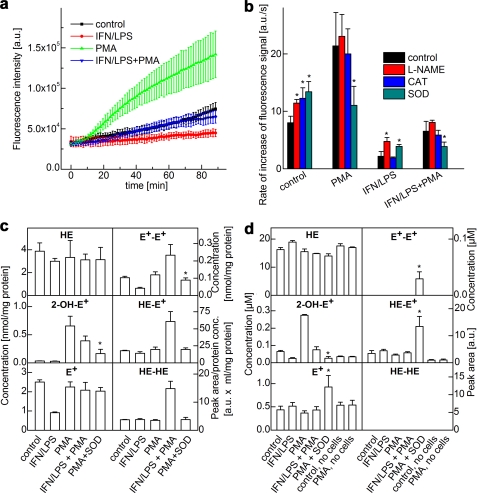
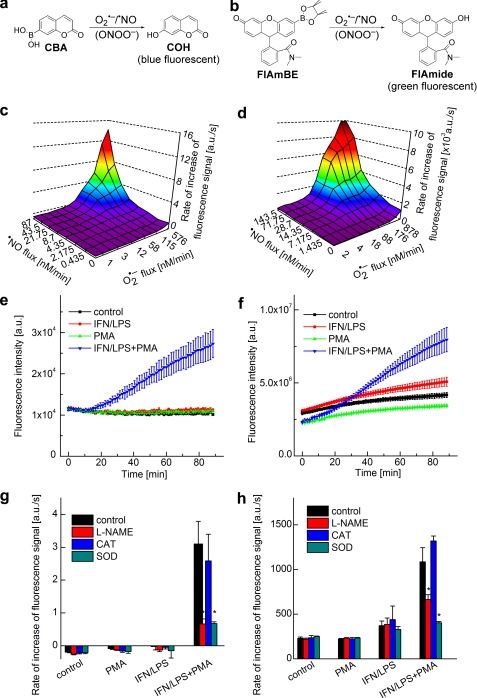
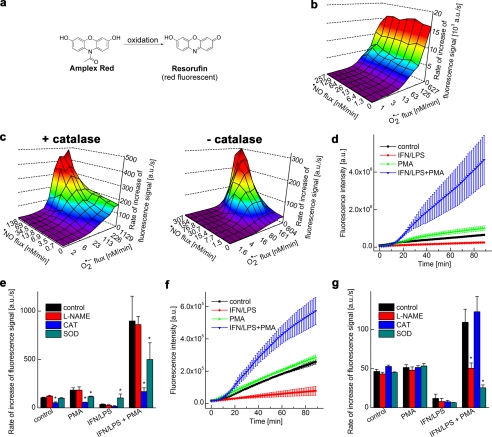
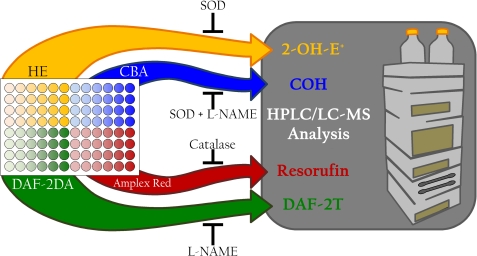
Herein we describe a high-throughput fluorescence and HPLC-based methodology for global profiling of reactive oxygen and nitrogen species (ROS/RNS) in biological systems. The combined use of HPLC and fluorescence detection is key to successful implementation and validation of this methodology. Included here are methods to specifically detect and quantitate the products formed from interaction between the ROS/RNS species and the fluorogenic probes, as follows: superoxide using hydroethidine, peroxynitrite using boronate-based probes, nitric oxide-derived nitrosating species with 4,5-diaminofluorescein, and hydrogen peroxide and other oxidants using 10-acetyl-3,7-dihydroxyphenoxazine (Amplex® Red) with and without horseradish peroxidase, respectively. In this study, we demonstrate real-time monitoring of ROS/RNS in activated macrophages using high-throughput fluorescence and HPLC methods. This global profiling approach, simultaneous detection of multiple ROS/RNS products of fluorescent probes, developed in this study will be useful in unraveling the complex role of ROS/RNS in redox regulation, cell signaling, and cellular oxidative processes and in high-throughput screening of anti-inflammatory antioxidants.


Figures

FIGURE 1.
FIGURE 1.
Peroxynitrite generation from co-generated O2˙̄ and NO. a, schemes showing the formation of O2˙̄ from incubations containing hypoxanthine (100 μm) and xanthine oxidase (0–0.4 milliunits/ml) in a phosphate buffer (pH 7.4; 50 mm) containing DTPA (100 μm), NO generation from a thermal decomposition of DPTA-NONOate (0–50 μm) and ONOO formed from co-generated O2˙̄ from HX/XO, and NO from DPTA-NONOate. b, stimulation of ONOO from RAW 264.7 macrophages using a mixture of PMA (200 ng/ml, IFN-γ (50 units/ml), and LPS (0.5 μg/ml). NO is produced from induction and activation of inducible nitric oxide synthase (iNOS), and superoxide is generated from activation of NADPH oxidase by PMA.
FIGURE 2.
FIGURE 2.
Oxidation of HE by O2˙̄, NO, and co-generated NO and O2˙̄ and global profiling of products. a, scheme showing HE oxidation by O2˙̄ to the hydroxylated, fluorescent product, 2-OH-E+, and nonspecific oxidation of HE to a red fluorescent product, E+, and non-fluorescent dimeric product, E+-E+, in the presence of NO and O2˙̄. For the sake of clarity, structures of other dimeric products, HE-HE and HE-E+, are not shown. b, diagrammatic representation of global profiling experiments. Varying fluxes of co-generated NO and O2˙̄ in a 96-well fluorescence plate containing either HE or CBA in phosphate buffer (50 mm, pH 7.4) containing DTPA (0.1 mm). c, increase in red fluorescence from HE oxidation detected in a 96-well fluorescence plate reader under experimental conditions described in b. a.u., arbitrary units. d, HPLC analyses of incubations with HE from the two corner wells on the right side in b are shown. Oxidation of HE (10 μm) was monitored by HPLC analyses after co-generation of NO and O2˙̄ in phosphate buffer (50 mm, pH 7.4) containing DTPA (0.1 mm). HE, E+, 2-OH-E+, and E+-E+ were quantified using the appropriate standard. e–h denote global profiling of HE, 2-OH-E+, E+, and E+-E+ levels, respectively, under the experimental conditions described in b.
FIGURE 3.
FIGURE 3.
Real-time monitoring of products of HE oxidation by activated macrophages. a, increase in fluorescence was monitored in a fluorescence plate reader (excitation at 485 nm, emission at 595 nm) from incubations containing RAW 264.7 macrophages activated by different stimulators as shown. a.u., arbitrary units. b, rate of increase in the fluorescence signal intensity from RAW 264.7 macrophages activated by different stimulators in the presence of l-NAME and ROS-detoxifying enzymes. CAT, catalase; SOD, superoxide dismutase. c, same as b except that HE-derived products in cell lysates were analyzed by HPLC after a 1-h incubation. d, same as c except that HE products were detected by HPLC in the media. *, p < 0.05.
FIGURE 4.
FIGURE 4.
Measurement of ONOO formation by monitoring oxidation of boronate-based fluorogenic probes. a, scheme showing oxidation of CBA to 7-hydroxycoumarin (COH) (blue fluorescence) by NO and O2˙̄. b, scheme showing oxidation of FlAmBE to the green fluorescent product, fluorescein N,N-dimethylamide (FlAmide), by NO and O2˙̄. c, blue fluorescence (excitation at 320 nm, emission at 440 nm) was monitored in a plate reader from incubations containing CBA (20 μm) in phosphate buffer in the presence of varying fluxes of NO and O2˙̄. a.u., arbitrary units. d, green fluorescence (excitation at 485 nm, emission at 535 nm) was monitored from incubations containing FlAmBE (20 μm) in phosphate buffer and varying fluxes of NO and O2˙̄. e, increase in the blue fluorescence intensity was monitored using a plate reader, derived from RAW 264.7 macrophages in DPBS-GP buffer containing CBA (20 μM) and different stimulators. f, increase in green fluorescence intensity was monitored using a plate reader from incubations containing RAW 264.7 macrophages and FlAmBE (20μM) in the presence of different stimulators. g, same as e but in the presence of l-NAME and ROS (O2˙̄ and H2O2)-detoxifying enzymes. h, same as f but in the presence of l-NAME and ROS (O2˙̄ and H2O2)-detoxifying enzymes. *, p < 0.05.
FIGURE 5.
FIGURE 5.
HPLC analyses of products formed from oxidation of CBA by activated macrophages. Incubations contained CBA (20 μm) and RAW 264.7 macrophages in DPBS-GP buffer in the presence of different stimulators. a, after a 60-min incubation, CBA-derived product was analyzed by HPLC under the same conditions as in the plate reader (Fig. 3b) using the wavelengths as shown in the figure. exc., excitation; emi., emission. b, same as a except that the CBA-derived product was analyzed in the cell culture media. c, conditions same as a except that it gives a quantitative analysis of CBA and COH in cell lysates and media.
FIGURE 6.
FIGURE 6.
Global profiling of H2O2 and ONOO-derived oxidants by monitoring the oxidation of Amplex® Red. a, scheme showing oxidation of Amplex® Red to a red fluorescent product, resorufin. b, increase in the fluorescence intensity (due to resorufin, excitation at 535 nm, emission at 595 nm) caused by HRP-dependent oxidation of Amplex® Red (20 μm) in phosphate buffer in the presence of co-generated NO and O2˙̄. a.u., arbitrary units. c, same as b except that HRP was not present. Note that the fluorescence intensity was greatly reduced as compared with b. d, oxidation of Amplex® Red (50 μm) by activated macrophages in the presence of HRP was measured. Increase in the fluorescence intensity was monitored in a fluorescence plate reader from incubations containing RAW 264.7 macrophages activated by different stimulators as shown. e, conditions were the same as in d except that the rate of increase in fluorescence intensity was measured in the presence of l-NAME and O2˙̄- and H2O2-detoxifying enzymes. CAT, catalase; SOD, superoxide dismutase. f, same as d but in the absence of HRP. Note the decrease in the fluorescence intensity of the product. g, same as f but in the presence of l-NAME and O2˙̄- and H2O2-detoxifying enzymes. *, p < 0.05.
FIGURE 7.
FIGURE 7.
Nitrosation of the probe, DAF-2DA, by co-generated NO and O2˙̄ and by activated macrophages. a, scheme showing the nitrosation of DAF-2 to the fluorescent product, DAF-2T. b, increase in green fluorescence (excitation at 485 nm, emission at 535 nm) during nitrosation of DAF-2 (5 μm) in phosphate buffer by co-generated NO and O2˙̄. a.u., arbitrary units. c, increase in green fluorescence due to DAF-2T was monitored in a fluorescence plate reader from incubations containing DAF-2DA (5 μm) and RAW 264.7 macrophages in the presence of different stimulators. d, same as c, but the rate of increase in the fluorescence intensity was monitored in the presence of l-NAME and other O2˙̄- and H2O2-detoxifying enzymes. CAT, catalase; SOD, superoxide dismutase. *, p < 0.05.
FIGURE 8.
FIGURE 8.
Suggested experimental design for identifying the reactive oxygen and nitrogen species generated simultaneously in response to a treatment of interest. The scheme describes the approach an investigator may take to determine which reactive oxygen and nitrogen species are produced in their system of interest. In a 96-well plate, cells treated as desired can be assayed using HE, CBA, DAF-2DA, and Amplex® Red. The use of a fluorescence plate reader for the initial screening, when coupled with inhibitors of specific oxidative products as indicated, allows for simultaneous detection of multiple reactive species. Information obtained from the plate reader can then be used to design more selective studies by UHPLC to verify and quantify the identity, location, and level of the products detected in the plate reader. DAF-2DA, diaminofluorescein–2 diacetate; SOD, superoxide dismutase.

Similar articles

Cited by

References

    1. Fruehauf J. P., Meyskens F. L., Jr. (2007) Reactive oxygen species: a breath of life or death? Clin. Cancer Res. 13, 789–794 - PubMed
    1. D'Autréaux B., Toledano M. B. (2007) ROS as signaling molecules: mechanisms that generate specificity in ROS homeostasis. Nat. Rev. Mol. Cell Biol. 8, 813–824 - PubMed
    1. Groeger A. L., Freeman B. A. (2010) Signaling actions of electrophiles: anti-inflammatory therapeutic candidates. Mol. Interv. 10, 39–50 - PMC - PubMed
    1. Veal E. A., Day A. M., Morgan B. A. (2007) Hydrogen peroxide sensing and signaling. Mol. Cell 26, 1–14 - PubMed
    1. Rhee S. G. (2006) Cell signaling. H2O2, a necessary evil for cell signaling. Science 312, 1882–1883 - PubMed

Publication types