

Mapping the local reaction kinetics by PEEM: CO oxidation on individual (100)-type grains of Pt foil
- PMID: 22140277
- PMCID: PMC3191274
- DOI: 10.1016/j.susc.2011.07.018
Mapping the local reaction kinetics by PEEM: CO oxidation on individual (100)-type grains of Pt foil
Abstract
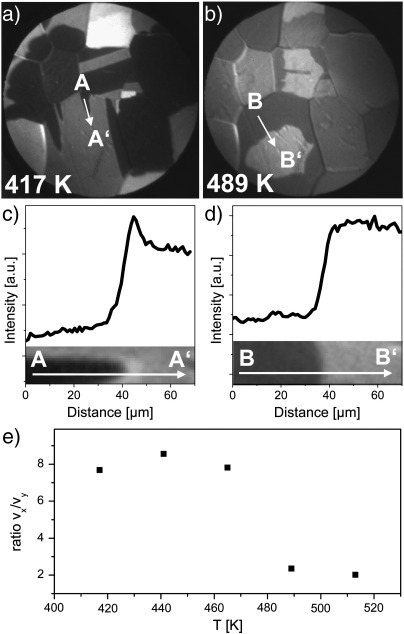
The locally-resolved reaction kinetics of CO oxidation on individual (100)-type grains of a polycrystalline Pt foil was monitored in situ using photoemission electron microscopy (PEEM). Reaction-induced surface morphology changes were studied by optical differential interference contrast microscopy and atomic force microscopy (AFM). Regions of high catalytic activity, low activity and bistability in a (p,T)-parameter space were determined, allowing to establish a local kinetic phase diagram for CO oxidation on (100) facets of Pt foil. PEEM observations of the reaction front propagation on Pt(100) domains reveal a high degree of propagation anisotropy both for oxygen and CO fronts on the apparently isotropic Pt(100) surface. The anisotropy vanishes for oxygen fronts at temperatures above 465 K, but is maintained for CO fronts at all temperatures studied, i.e. in the range of 417 to 513 K. A change in the front propagation mechanism is proposed to explain the observed effects.
Figures


Similar articles
-
The Role of Defects in the Local Reaction Kinetics of CO Oxidation on Low-Index Pd Surfaces.J Phys Chem C Nanomater Interfaces. 2013 Jun 13;117(23):12054-12060. doi: 10.1021/jp312510d. Epub 2013 May 17. J Phys Chem C Nanomater Interfaces. 2013. PMID: 23785524 Free PMC article.
-
Silicon Oxide Surface Segregation in CO Oxidation on Pd: An in situ PEEM, MS and XPS Study.Catal Letters. 2013 Mar;143(3):235-240. doi: 10.1007/s10562-012-0955-5. Epub 2013 Jan 8. Catal Letters. 2013. PMID: 23482699 Free PMC article.
-
Spatially coupled catalytic ignition of CO oxidation on Pt: mesoscopic versus nano-scale.Ultramicroscopy. 2015 Dec;159 Pt 2:178-83. doi: 10.1016/j.ultramic.2015.05.012. Epub 2015 May 14. Ultramicroscopy. 2015. PMID: 26021411 Free PMC article.
-
Local reaction kinetics by imaging.Surf Sci. 2016 Jan;643:52-58. doi: 10.1016/j.susc.2015.05.021. Surf Sci. 2016. PMID: 26865736 Free PMC article.
-
Challenges in applying photoemission electron microscopy to biological systems.Photochem Photobiol. 2009 Jan-Feb;85(1):8-20. doi: 10.1111/j.1751-1097.2008.00484.x. Epub 2008 Dec 6. Photochem Photobiol. 2009. PMID: 19076307 Review.
Cited by
-
The Role of Defects in the Local Reaction Kinetics of CO Oxidation on Low-Index Pd Surfaces.J Phys Chem C Nanomater Interfaces. 2013 Jun 13;117(23):12054-12060. doi: 10.1021/jp312510d. Epub 2013 May 17. J Phys Chem C Nanomater Interfaces. 2013. PMID: 23785524 Free PMC article.
-
Operando Surface Spectroscopy and Microscopy during Catalytic Reactions: From Clusters via Nanoparticles to Meso-Scale Aggregates.Small. 2021 Jul;17(27):e2004289. doi: 10.1002/smll.202004289. Epub 2021 Mar 10. Small. 2021. PMID: 33694320 Free PMC article. Review.
-
Heterogeneous Surfaces as Structure and Particle Size Libraries of Model Catalysts.Catal Letters. 2018;148(10):2947-2956. doi: 10.1007/s10562-018-2506-1. Epub 2018 Jul 31. Catal Letters. 2018. PMID: 30393447 Free PMC article.
-
Local catalytic ignition during CO oxidation on low-index Pt and Pd surfaces: a combined PEEM, MS, and DFT study.Angew Chem Int Ed Engl. 2012 Oct 1;51(40):10041-4. doi: 10.1002/anie.201204031. Epub 2012 Sep 7. Angew Chem Int Ed Engl. 2012. PMID: 22961996 Free PMC article.
-
Surface-Structure Libraries: Multifrequential Oscillations in Catalytic Hydrogen Oxidation on Rhodium.J Phys Chem C Nanomater Interfaces. 2019 Feb 21;123(7):4217-4227. doi: 10.1021/acs.jpcc.8b11421. Epub 2019 Jan 23. J Phys Chem C Nanomater Interfaces. 2019. PMID: 31057690 Free PMC article.
References
-
- Ertl G. Angew. Chem. Int. Ed. 2008;47:3524. (Nobel Prize lecture) and references therein. - PubMed
-
- Zhdanov V.P., Kasemo B. Surf. Sci. Rep. 1994;20:113.
-
- Suchorski Y., Beben J., Imbihl R. Prog. Surf. Sci. 1998;59:343.
-
- Suchorski Y., Beben J., James E.W., Evans J.W., Imbihl R. Phys. Rev. Lett. 1999;82:1907.
-
- Suchorski Y., Spiel C., Vogel D., Drachsel W., Schlögl R., Rupprechter G. ChemPhysChem. 2010;11:3231. - PubMed
LinkOut - more resources
Full Text Sources
Miscellaneous