. 2011;6(11):e27633.
doi: 10.1371/journal.pone.0027633. Epub 2011 Nov 30.

Personality is reflected in the brain's intrinsic functional architecture

Affiliations

Personality is reflected in the brain's intrinsic functional architecture

Jonathan S Adelstein et al. PLoS One. 2011.

Abstract

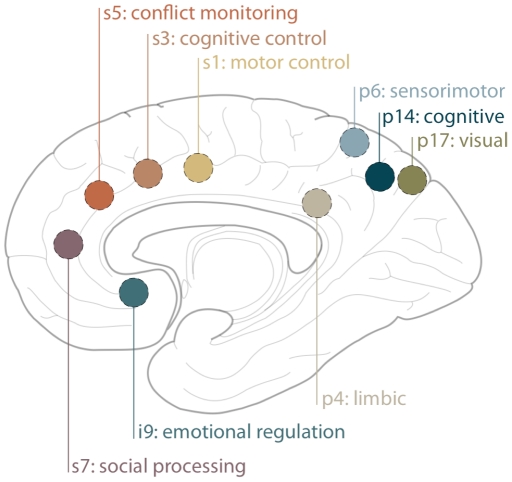
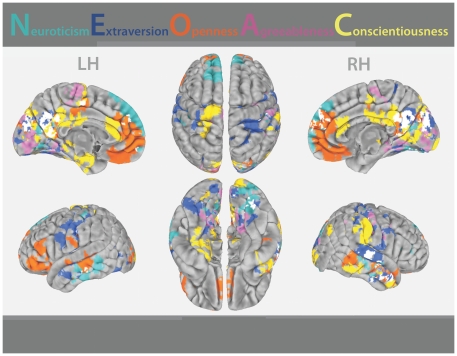
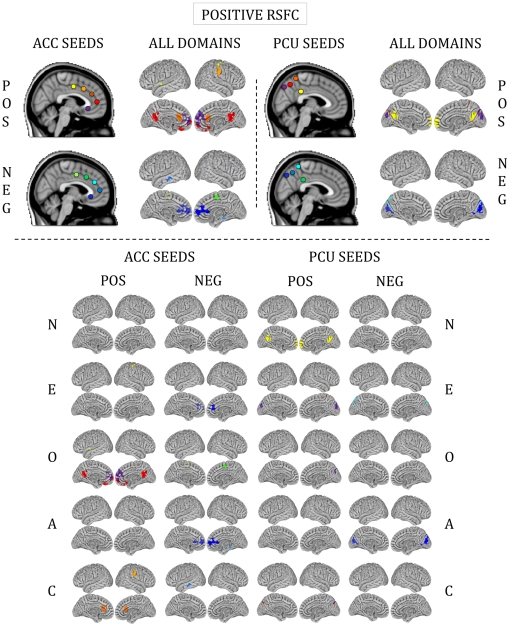
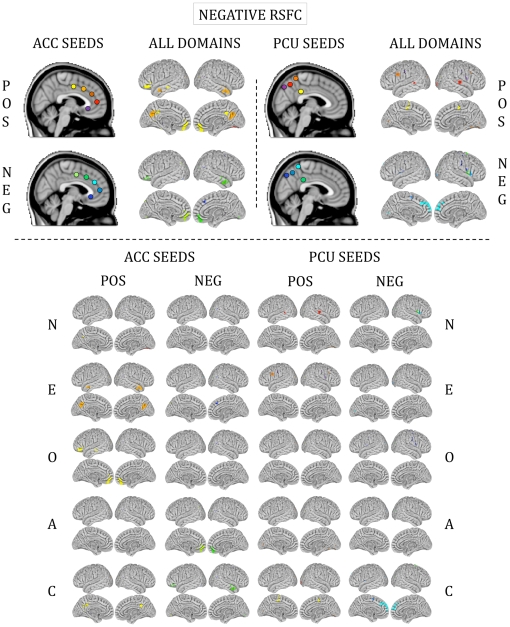
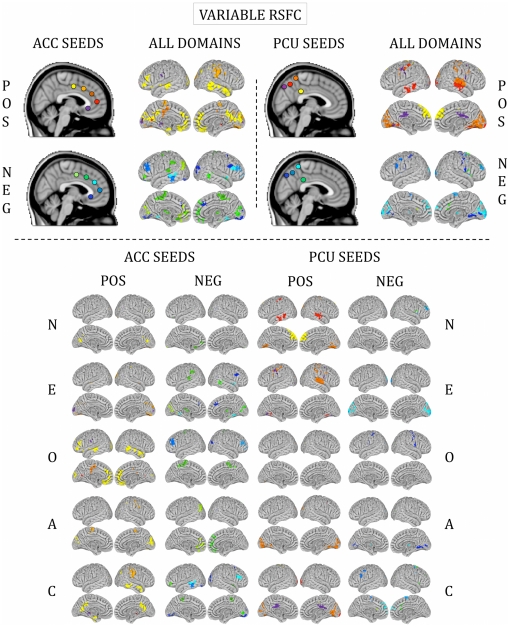
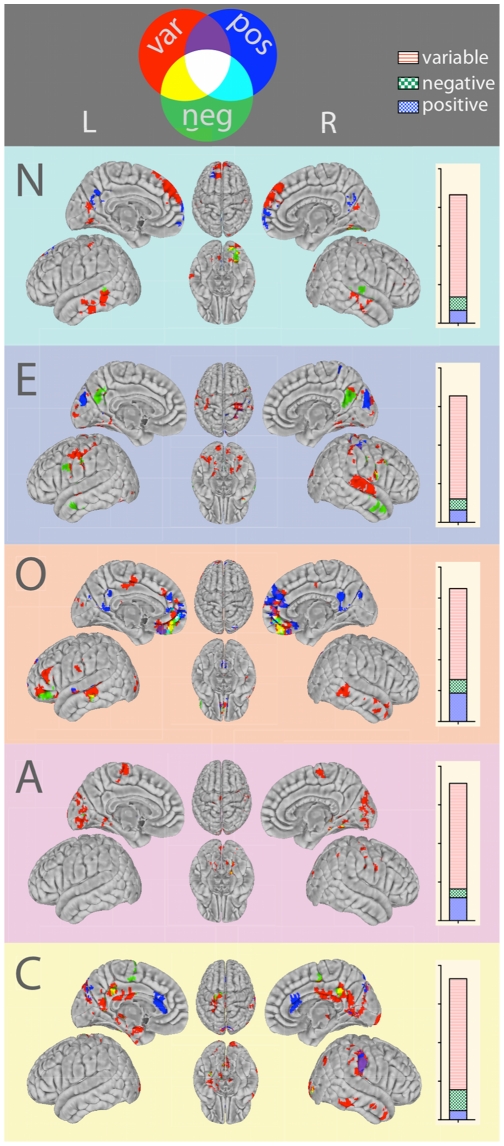
Personality describes persistent human behavioral responses to broad classes of environmental stimuli. Investigating how personality traits are reflected in the brain's functional architecture is challenging, in part due to the difficulty of designing appropriate task probes. Resting-state functional connectivity (RSFC) can detect intrinsic activation patterns without relying on any specific task. Here we use RSFC to investigate the neural correlates of the five-factor personality domains. Based on seed regions placed within two cognitive and affective 'hubs' in the brain--the anterior cingulate and precuneus--each domain of personality predicted RSFC with a unique pattern of brain regions. These patterns corresponded with functional subdivisions responsible for cognitive and affective processing such as motivation, empathy and future-oriented thinking. Neuroticism and Extraversion, the two most widely studied of the five constructs, predicted connectivity between seed regions and the dorsomedial prefrontal cortex and lateral paralimbic regions, respectively. These areas are associated with emotional regulation, self-evaluation and reward, consistent with the trait qualities. Personality traits were mostly associated with functional connections that were inconsistently present across participants. This suggests that although a fundamental, core functional architecture is preserved across individuals, variable connections outside of that core encompass the inter-individual differences in personality that motivate diverse responses.


Conflict of interest statement

Competing Interests: The authors have declared that no competing interests exist.

Figures

Figure 1
Figure 1. Seed locations.
General location of the nine seeds: five within the anterior cingulate cortex (ACC; seeds s1, s3, s5, s7 and i9) and four within the precuneus (PCU; seeds p4, p6, p14, p17). Also shown are associated functions of each of these regions , , . Seed coordinates are listed in Supporting Table S2.
Figure 2
Figure 2. Personality trait measures predicted RSFC.
Connections identified as having a relationship with personality, grouped by color according to the personality domain that predicted their RSFC. For the purpose of illustration, significant findings were collapsed across seed regions and RSFC/personality score relationship valence (i.e., whether the correlation was significantly positive or negative). Individual seed region findings are presented separately in Figures 3– 5. White represents overlap of findings for multiple (one or more) personality domains predicting RSFC. LH = left hemisphere; RH = right hemisphere.
Figure 3
Figure 3. Functional connections predicted by positive RSFC.
Surface maps of regions whose RSFC with ACC and PCU seeds was predicted by personality. These maps illustrate positive RSFC only. Colors on the surface maps represent RSFC with the seeds shown at the top in corresponding colors. “All domains” refers to all five personality domains combined into a single map. POS = positive relationships (stronger RSFC relationships with higher personality score); NEG = negative relationships (stronger RSFC relationships with lower personality score). N = Neuroticism; E = Extraversion; O = Openness to Experience; A = Agreeableness; C = Conscientiousness.
Figure 4
Figure 4. Functional connections predicted by negative RSFC.
Surface maps of regions whose RSFC with ACC and PCU seeds was predicted by personality. These maps illustrate negative RSFC only. Colors on the surface maps represent RSFC with the seeds shown at the top in corresponding colors. “All domains” refers to all five personality domains combined into a single map. POS = positive relationships (stronger RSFC relationships with higher personality score); NEG = negative relationships (stronger RSFC relationships with lower personality score). N = Neuroticism; E = Extraversion; O = Openness to Experience; A = Agreeableness; C = Conscientiousness.
Figure 5
Figure 5. Functional connections predicted by variable RSFC.
Surface maps of regions whose RSFC with ACC and PCU seeds was predicted by personality. These maps illustrate variable RSFC only. Colors on the surface maps represent RSFC with the seeds shown at the top in corresponding colors. “All domains” refers to all five personality domains combined into a single map. POS = positive relationships (stronger RSFC relationships with higher personality score); NEG = negative relationships (stronger RSFC relationships with lower personality score). N = Neuroticism; E = Extraversion; O = Openness to Experience; A = Agreeableness; C = Conscientiousness.
Figure 6
Figure 6. Functional connections predicted by personality are variable across participants.
Regions whose RSFC with ACC and PCU seeds was predicted by each of the five personality domains, grouped by color according to the valence of their RSFC—that is, whether the region was significantly (i.e., consistently) positively correlated (“invariant positive”; pos), significantly negatively correlated (“invariant negative”; neg), or not significantly correlated (“variable”; var) with the relevant seed region of interest, across all ACC and PCU seeds. Results are segregated by the relevant personality domain that predicted RSFC. Histograms to the right of the surface maps quantify the number of voxels identified as having a relationship with personality score, grouped according to their RSFC valence. As illustrated at the top of the figure, for both brain regions and histogram categories, blue corresponds to “positive” RSFC valence, green corresponds to “negative” RSFC valence, and red corresponds to “variable” RSFC valence. L = left hemisphere; R = right hemisphere; N = Neuroticism; E = Extraversion; O = Openness to Experience; A = Agreeableness; C = Conscientiousness.

References

    1. Canli T, Amin Z. Neuroimaging of emotion and personality: scientific evidence and ethical considerations. Brain Cogn. 2002;50:414–431. - PubMed
    1. DeYoung CG, Gray JR. Personality neuroscience: Explaining individual differences in affect, behavior and cognition. In: Corr PJ, Matthews G, editors. The Cambridge handbook of personality psychology. New York: Cambridge University Press; 2009.
    1. Digman JM. Higher-order factors of the Big Five. J Pers Soc Psychol. 1997;73:1246–1256. - PubMed
    1. Costa PT, Jr, McCrae RR. NEO PI-R Professional Manual. Odessa, FL: Psychological Assessment Resources; 1992.
    1. John OP, Naumann LP, Soto CJ. Paradigm shift to the integrative Big Five trait taxonomy: History, measurement, and conceptual issues. In: John OP, Robins RW, Pervin LA, editors. Handbook of personality: Theory and research. New York: Guilford Press; 2008. pp. 114–156.

Publication types