. 2011;6(11):e28085.
doi: 10.1371/journal.pone.0028085. Epub 2011 Nov 29.

Congenital cataract causing mutants of αA-crystallin/sHSP form aggregates and aggresomes degraded through ubiquitin-proteasome pathway

Affiliations

Congenital cataract causing mutants of αA-crystallin/sHSP form aggregates and aggresomes degraded through ubiquitin-proteasome pathway

Ilangovan Raju et al. PLoS One. 2011.

Abstract

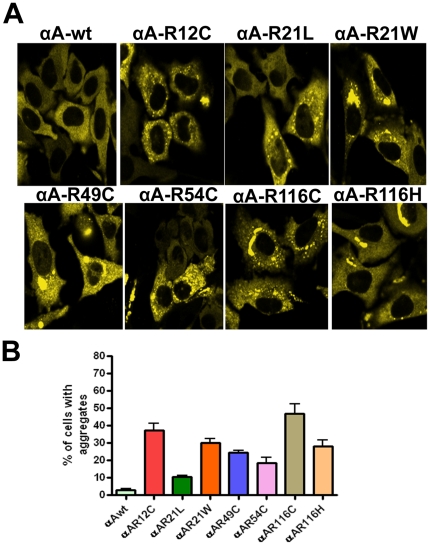
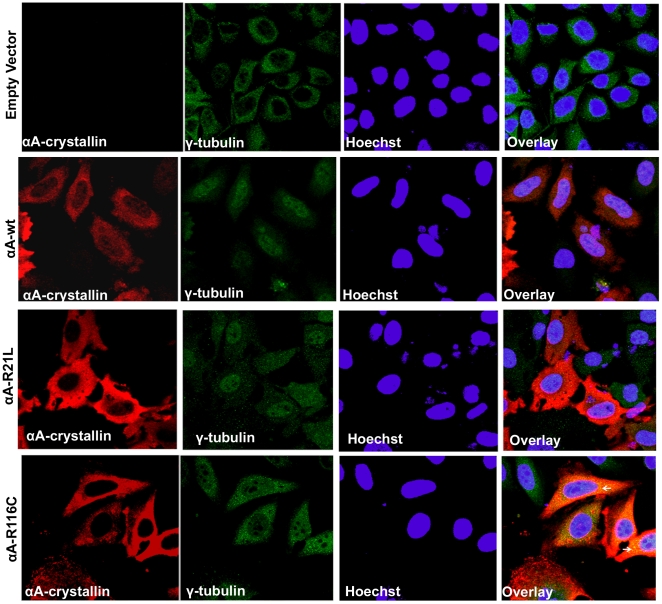
Background: Mutations of human αA-crystallin cause congenital cataract by protein aggregation. How mutations of αA-crystallin cause disease pathogenesis through protein aggregation is not well understood. To better understand the cellular events leading to protein aggregation, we transfected cataract causing mutants, R12C, R21L, R21W, R49C, R54C, R116C and R116H, of human αA-crystallin in HeLa cells and examined the formation of intracellular protein aggregates and aggresomes by confocal microscopy.

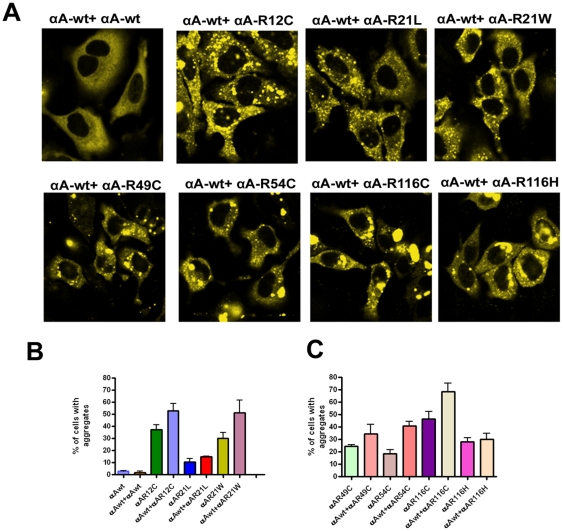
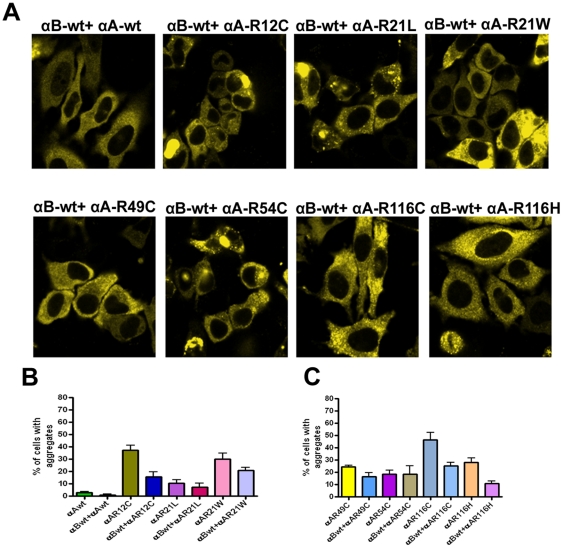
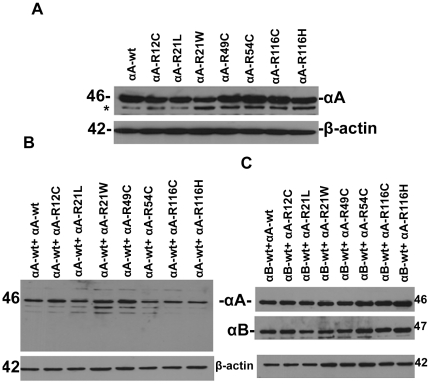
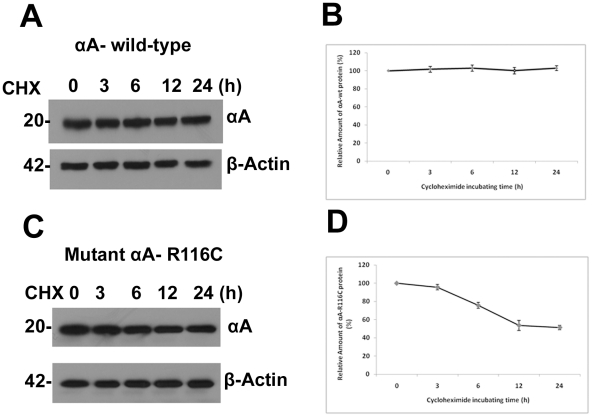
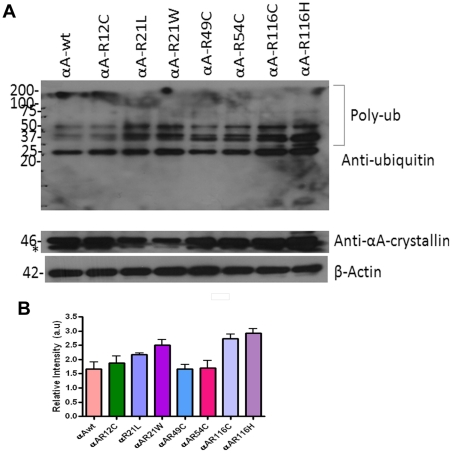
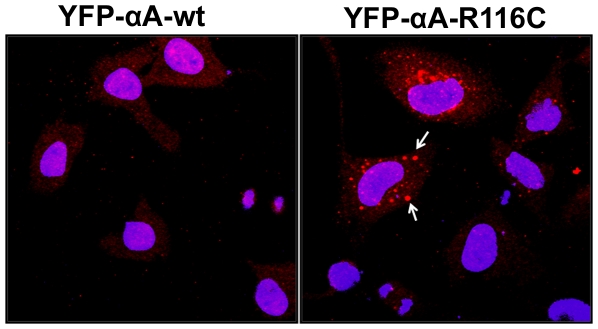
Methodology/principal findings: YFP-tagged human αA-wild-type (αA-wt) was sub-cloned and the mutants were generated by site-directed mutagenesis. The αA-wt and the mutants were individually transfected or co-transfected with CFP-tagged αA-wt or αB-wild-type (αB-wt) in HeLa cells. Overexpression of these mutants forms multiple small dispersed cytoplasmic aggregates as well as aggresomes. Co-expression of αB-wt with these mutants significantly inhibited protein aggregates where as co-expression with αA-wt enhanced protein aggregates which seems to be due to co-aggregation of the mutants with αA-wt. Aggresomes were validated by double immunofluorescence by co-localization of γ-tubulin, a centrosome marker protein with αA-crystallin. Furthermore, increased ubiquitination was detected in R21W, R116C and R116H as assessed by western blot analyses. Immunostaining with an ubiquitin antibody revealed that ubiquitin inclusions in the perinuclear regions were evident only in R116C transfected cells. Pulse chase assay, after cycloheximide treatment, suggested that R116C degraded faster than the wild-type control.

Conclusions/significance: Mutants of αA-crystallin form aggregates and aggresomes. Co-expression of αA-wt with the mutants increased aggregates and co-expression of αB-wt with the mutants significantly decreased the aggregates. The mutant, R116C protein degraded faster than wild-type control and increased ubiquitination was evident in R116C expressing cells.


Conflict of interest statement

Competing Interests: The authors have declared that no competing interests exist.

Figures

Figure 1
Figure 1. YFP-αA-wt and the mutant constructs, R12C, R21L, R21W, R49C, R54C, R116C and R116H were individually expressed in HeLa cells.
A: LSM Images were captured after 48 hours transfection. HeLa cells were individually transfected with 2 µg of YFP-tagged αA-wt and mutants of αA-crystallin. A homogenous expression of αA-crystallin was evident in αA-wt transfected cells. Cytoplasmic aggregates were evident in αA- crystallin mutants transfected cells. The YFP signal was excited at 514 nm and the images were collected by BP 530-600 nm filter. The images represent one of the four similar images obtained in three independent experiments. B: Graph represents per cent of cells with aggregates. The results obtained after 48 hours transfection for the individually expressed αA-wt or its mutants in HeLa cells. Cells containing aggregates were counted in 10 random fields each field with 30 cells. The mutant, R116C showed a high per cent (∼47) of cells having aggregates and the mutant R21L showed least per cent (∼10) of cells containing aggregates. The results were presented as means ± SD obtained in three independent experiments. All the mutants were statistically significant, p < 0.01.
Figure 2
Figure 2. YFP-αA-wt and its mutants were co-expressed with CFP-tagged αA-wt.
A: Laser scanning confocal microscope images. HeLa cells were transfected with 1 µg each of CFP-tagged αA-wt and YFP-tagged mutant constructs. After 48 h transfection, cells were analyzed with confocal microscope. Cells showed more aggregates when co-expressed with αA-wt. The CFP signal was excited at 458 nm and the images were collected by BP 475–525 nm filter, YFP was excited at 514 nm and the images were collected by BP 530–600 nm filter. The images represent one of the four similar images obtained in three independent experiments. B&C: Graph represents per cent of cells with aggregates. Cells were transfected with YFP-tagged αA-wt or mutants and CFP-tagged αA-wt. Cells having aggregates were counted in 10 random fields each field with 30 cells after 48 h transfection. The results were presented as means ± SD obtained in three independent experiments. For αA-wt + αA-R12C: p < 0.03; for αA-wt + αA-R21L : < 0.05; for αA-wt + αA-R21W : < 0.04, for αA-wt + αA-R49C, is not significant; for αA-wt + αA-R54C : < 0.0001; for αA-wt + αA-R116C : < 0.01 and for αA-wt + αA-R116H, is not significant.
Figure 3
Figure 3. YFP-tagged αA-wt and each of the mutated αA-crystallin co-expressed with CFP-αB-wt.
A: LSM images of HeLa cells after 48 h transfection. HeLa cells were transfected with 1 µg each of CFP-tagged αB-wt and YFP-tagged αA-wt and the mutants. After 48 h transfection, images were captured with an LSM confocal microscope. The CFP signal was excited at 458 nm and the images were collected by BP 475–525 nm filter, YFP was excited at 514 nm and the images were collected by BP 530–600 nm filter. Co-expression of αB-wt significantly inhibited aggregates in cells transfected with the αA- mutants. Images represent one of the four similar images obtained in three independent experiments. B&C: Graph represents per cent of cells containing aggregates. The results obtained after 48 h transfection. Cells containing aggregates were counted in 10 random fields each field with 30 cells. In all mutants, co-expression of αB-wt except with R21L and R54C significantly decreased the number of cells having aggregates. The results were presented as means ± SD obtained in three independent experiments. The p value for αB-wt + αA-R12C is < 0.02; for αB-wt + αA-R21L is not significant; for αB-wt + αA-R21W is < 0.05; for αB-wt + αA-R49C is < 0.02; for αB-wt + αA-R54C is not significant, for αB-wt + αA-R116C is < 0.01 and for αB-wt + αA-R116H is < 0.001.
Figure 4
Figure 4. Western blot analysis of αA-crystallin-wt and its mutants, R12C, R21L, R21W, R49C, R54C, R116C and R116H expressed in HeLa cells.
A. Western blot analysis of HeLa cells individually expressed with αA-Crystallin: Cells were individually transfected with YFP-tagged αA-wt and mutants. After 48 h transfection, cells were lysed and 5 µg of total protein was subjected to western blot. The blot was probed with human anti-αA antibody. The same blot was stripped and re-probed for β- actin to serves as a loading control. Nearly a similar level of expression of αA was evident in each of the transfected cells. The * indicates the non-speficific band. B: Western blot analysis of HeLa cells co-expressed with CFP-tagged αA-wt and YFP-tagged αA-wt or its mutants. Cells were co-transfected with YFP-tagged αA-wt and mutants with CFP-tagged αA-wt. After 48 h transfection, cells were lysed and 5 µg of total protein was subjected to western blot. The blot was probed with an antibody against human αA and the same blot was stripped and re-probed for actin. A similar level of expression of αA was detected in each group. C: Western blot analysis of HeLa cells co-expressed with CFP-tagged αB-wt and YFP-tagged αA-wt or its mutants. After 48 h transfection, 5 µg of total protein was subjected to western blot. The blot was probed with an antibody against human αA and the same blot was stripped and re-probed for anti-αB. The same blot was again stripped with anti-β-actin for loading control. The level of both αA and αB were nearly equal in each of the transfected cells.
Figure 5
Figure 5. Detection of Aggresomes: Untagged pCDNA3.1 constructs of αA-wt and the mutants, R21L and R116C were used in this study and compared.
After 48 h transfection, cells were fixed, permeabilized with 0.5% Triton X-100 and double immunostained with a mouse monoclonal αA-crystallin (red) antibody and a rabbit polyclonal antibody for γ-tubulin (green). A strong degree of overlapping signal (yellow) was evident only in R116C transfected cells (arrow). Co-localization of γ-tubulin, a centrosome maker protein with αA-crystallin in the perinuclear region validated these inclusions were aggresomes. There was no co-localization in cells transfected with either αA-wt or the mutant, R21L. Goat anti-mouse Alexa Fluor 594 (red) antibody was used to stain and visualize the localization of αA-wt and the mutants, R21L and R116C. A rabbit secondary antibody, Alexa Fluor 488 (green) was used to stain and visualize the γ-tubulin. The nuclear stain Hoechst was used to counter stain the nuclei. The images were representative of one of four such images obtained in three independent experiments.
Figure 6
Figure 6. Degradation of aggregate-prone αA-crystallin mutant, R116C.
A and C: Western blot analysis of cycloheximide treated cells: HeLa cells were transfected with 2 µg of untagged pCDNA3.1 constructs of αA-wt and the mutant, R116C. After 24 h transfection, cells were treated with 20 µg/ml of cycloheximide and lysed with lysis buffer at indicated time points. For each of the sample, 5 µg of total protein was loaded and western blot probed with an anti-αA-crystallin (rabbit polyclonal, Enzo Life Sciences Inc., Catalog # SPA-221). The mutant R116C protein level has decreased after 6 hours treatment with cycloheximide compared to wild-type protein which demonstrated R116C protein instability. The β-Actin blot serves as a loading control. B and D: Quantification of wild-type and the mutant, R116C protein at different time points. The density of the band was quantified using NIH Image J software and plotted. Values represent as means ± SD as obtained in three independent experiments. The mutant, R116C Vs wild-type control is significant at p < 0.001.
Figure 7
Figure 7. Overexpression of αA-Crystallin mutants showed increased ubiquitination.
A: Western blot analysis: After 48 h transfection, cells were lysed and 5 µg of total protein was subjected to immunoblot probed with an anti-ubiquitin (FK2) monoclonal antibody. The pattern of polyubiquitinated species were dramatically increased in the mutants, R21W, R116C and R116H compared to other mutants and wild-type. * indicates a non-specific band. The same blot was stripped and re-probed for αA-crystallin and β-actin for loading controls. The blot shown here is a representative blot of three independent experiments. B: Quantitative data for the western blot: Using NIH Image J software, densitometric measurements were normalized against β-actin. The mutants, R21L, R21W, R116C and R116H showed increased ubiquitination as obtained in three independent experiments and plotted. The results were expressed as mean ± SD. The p value for αA-wt Vs αA-R12C is not significant, for αA-wt Vs αA-R21L is < 0.05; for αA-wt Vs αA-R21W is < 0.01; for αA-wt Vs αA-R49C is not significant; for αA-wt Vs αA-R54C is not significant; for αA-wt Vs αA-R116C is < 0.003 and for αA-wt Vs αA-R116H is < 0.001.
Figure 8
Figure 8. Overexpression of αA-crystallin mutants shows accumulation of ubiquitin inclusions in HeLa cells.
YFP-tagged αA-wt and mutant, R116C were transfected in HeLa cells. After 48 h transfection, cells were fixed and immunostained with a mouse monoclonal ubiquitin (FK2) antibody and further stained with a fluorescent conjugated secondary antibody, Alexa Flour 594 (red). The arrows indicate ubiquitinated cytoplasmic inclusions only in the mutant, R116C expressing cells. Hoechst 33342 was used to counter stain the nuclei. The images were representative of three similar images obtained in three independent experiments.

Similar articles

Cited by

References

    1. Reddy MA, Francis JP, Berry V, Bhattacharya S, Moore AT. Molecular genetic basis of inherited cataract and associated phenotypes. Sur Opthalmol. 2004;49:300–315. - PubMed
    1. De Jong WW, Terwindt EC, Bloemendal H. The amino acid sequence of the A chain of human alpha-crystallin. FEBS Lett. 1975;58:310–313. - PubMed
    1. Horwitz J. Alpha-crystallin can function as a molecular chaperone. Proc Natl Acad Sci USA. 1992;89:10449–10453. - PMC - PubMed
    1. Hansen L, Yao W, Eiberg H, Kjaer KW, Baggesen K, et al. Genetic heterogeneity in microcornea-cataract: five novel mutations in CRYAA, CRYGD and GJA8. Invest Opthalmol Vis Sci. 2007;48:3937–3944. - PubMed
    1. Xia C, Liu H, Chang B, Cheung D, Wang M, et al. Arginine 54 and Tyrosine 118 Residues of αA-Crystallin are Crucial for Lens Formation and Transparency. Invest Opthalmol Vis Sci. 2006;47:3004–3010. - PubMed

Publication types

MeSH terms