

Detecting low frequent loss-of-function alleles in genome wide association studies with red hair color as example
- PMID: 22140526
- PMCID: PMC3226656
- DOI: 10.1371/journal.pone.0028145
Detecting low frequent loss-of-function alleles in genome wide association studies with red hair color as example
Abstract
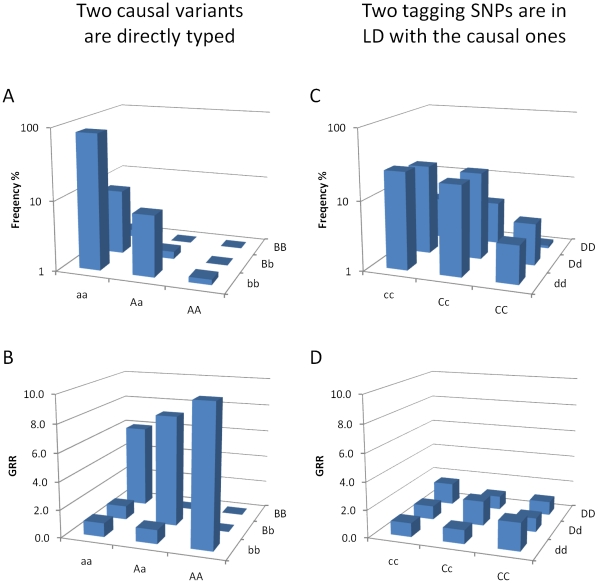
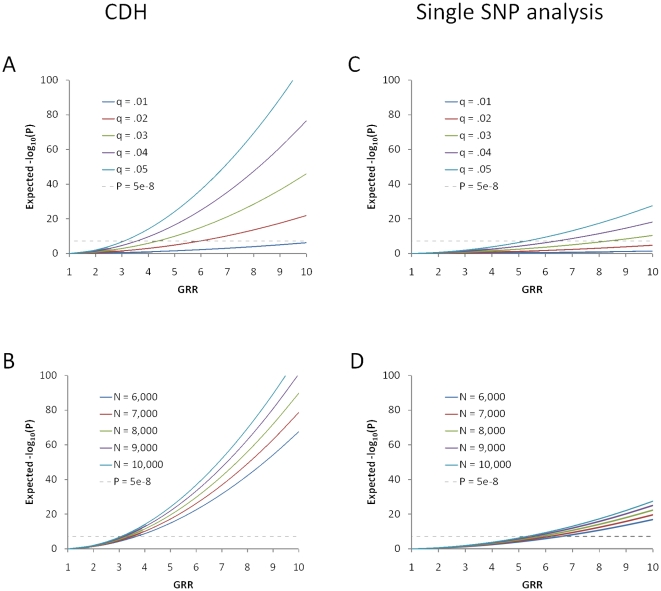
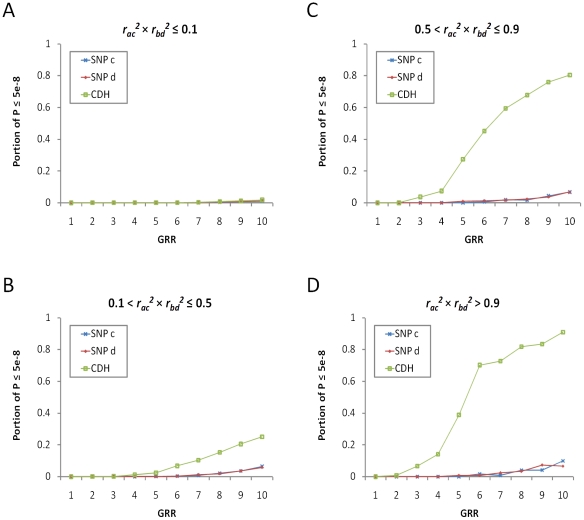
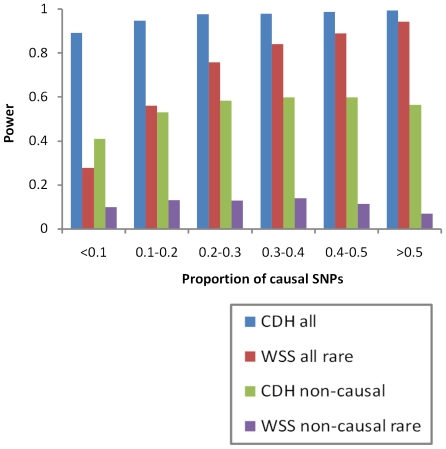
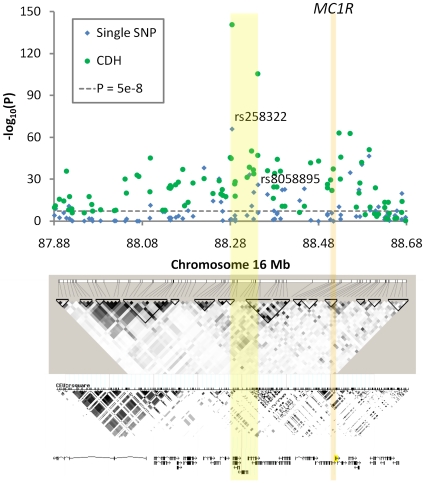
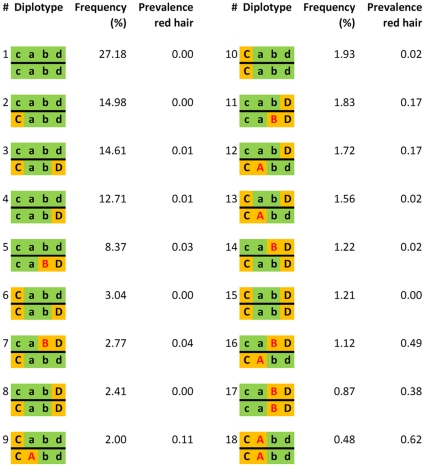
Multiple loss-of-function (LOF) alleles at the same gene may influence a phenotype not only in the homozygote state when alleles are considered individually, but also in the compound heterozygote (CH) state. Such LOF alleles typically have low frequencies and moderate to large effects. Detecting such variants is of interest to the genetics community, and relevant statistical methods for detecting and quantifying their effects are sorely needed. We present a collapsed double heterozygosity (CDH) test to detect the presence of multiple LOF alleles at a gene. When causal SNPs are available, which may be the case in next generation genome sequencing studies, this CDH test has overwhelmingly higher power than single SNP analysis. When causal SNPs are not directly available such as in current GWA settings, we show the CDH test has higher power than standard single SNP analysis if tagging SNPs are in linkage disequilibrium with the underlying causal SNPs to at least a moderate degree (r²>0.1). The test is implemented for genome-wide analysis in the publically available software package GenABEL which is based on a sliding window approach. We provide the proof of principle by conducting a genome-wide CDH analysis of red hair color, a trait known to be influenced by multiple loss-of-function alleles, in a total of 7,732 Dutch individuals with hair color ascertained. The association signals at the MC1R gene locus from CDH were uniformly more significant than traditional GWA analyses (the most significant P for CDH = 3.11×10⁻¹⁴² vs. P for rs258322 = 1.33×10⁻⁶⁶). The CDH test will contribute towards finding rare LOF variants in GWAS and sequencing studies.
Conflict of interest statement
Figures
Similar articles
-
CollapsABEL: an R library for detecting compound heterozygote alleles in genome-wide association studies.BMC Bioinformatics. 2016 Apr 8;17:156. doi: 10.1186/s12859-016-1006-9. BMC Bioinformatics. 2016. PMID: 27059780 Free PMC article.
-
A study in scarlet: MC1R as the main predictor of red hair and exemplar of the flip-flop effect.Hum Mol Genet. 2019 Jun 15;28(12):2093-2106. doi: 10.1093/hmg/ddz018. Hum Mol Genet. 2019. PMID: 30657907 Free PMC article.
-
Detection of common single nucleotide polymorphisms synthesizing quantitative trait association of rarer causal variants.Genome Res. 2011 Jul;21(7):1122-30. doi: 10.1101/gr.115832.110. Epub 2011 Mar 25. Genome Res. 2011. PMID: 21441355 Free PMC article.
-
The role of melanocortin-1 receptor polymorphism in skin cancer risk phenotypes.Pigment Cell Res. 2003 Jun;16(3):266-72. doi: 10.1034/j.1600-0749.2003.00041.x. Pigment Cell Res. 2003. PMID: 12753400 Review.
-
The melanocortin 1 receptor (MC1R): more than just red hair.Pigment Cell Res. 2000 Jun;13(3):135-40. doi: 10.1034/j.1600-0749.2000.130303.x. Pigment Cell Res. 2000. PMID: 10885670 Review.
Cited by
-
Genetics of skin color variation in Europeans: genome-wide association studies with functional follow-up.Hum Genet. 2015 Aug;134(8):823-35. doi: 10.1007/s00439-015-1559-0. Epub 2015 May 12. Hum Genet. 2015. PMID: 25963972 Free PMC article.
-
Comprehensive candidate gene study highlights UGT1A and BNC2 as new genes determining continuous skin color variation in Europeans.Hum Genet. 2013 Feb;132(2):147-58. doi: 10.1007/s00439-012-1232-9. Epub 2012 Oct 11. Hum Genet. 2013. PMID: 23052946
-
Dissecting genome-wide association signals for loss-of-function phenotypes in sorghum flavonoid pigmentation traits.G3 (Bethesda). 2013 Nov 6;3(11):2085-94. doi: 10.1534/g3.113.008417. G3 (Bethesda). 2013. PMID: 24048646 Free PMC article.
-
CollapsABEL: an R library for detecting compound heterozygote alleles in genome-wide association studies.BMC Bioinformatics. 2016 Apr 8;17:156. doi: 10.1186/s12859-016-1006-9. BMC Bioinformatics. 2016. PMID: 27059780 Free PMC article.
-
A Genome-Wide Association Study Identifies the Skin Color Genes IRF4, MC1R, ASIP, and BNC2 Influencing Facial Pigmented Spots.J Invest Dermatol. 2015 Jul;135(7):1735-1742. doi: 10.1038/jid.2015.62. Epub 2015 Feb 23. J Invest Dermatol. 2015. PMID: 25705849
References
Publication types
MeSH terms
Substances
LinkOut - more resources
Full Text Sources
