

Phosphorylation of yeast transcription factors correlates with the evolution of novel sequence and function
- PMID: 22141333
- PMCID: PMC4077355
- DOI: 10.1021/pr201065k
Phosphorylation of yeast transcription factors correlates with the evolution of novel sequence and function
Abstract
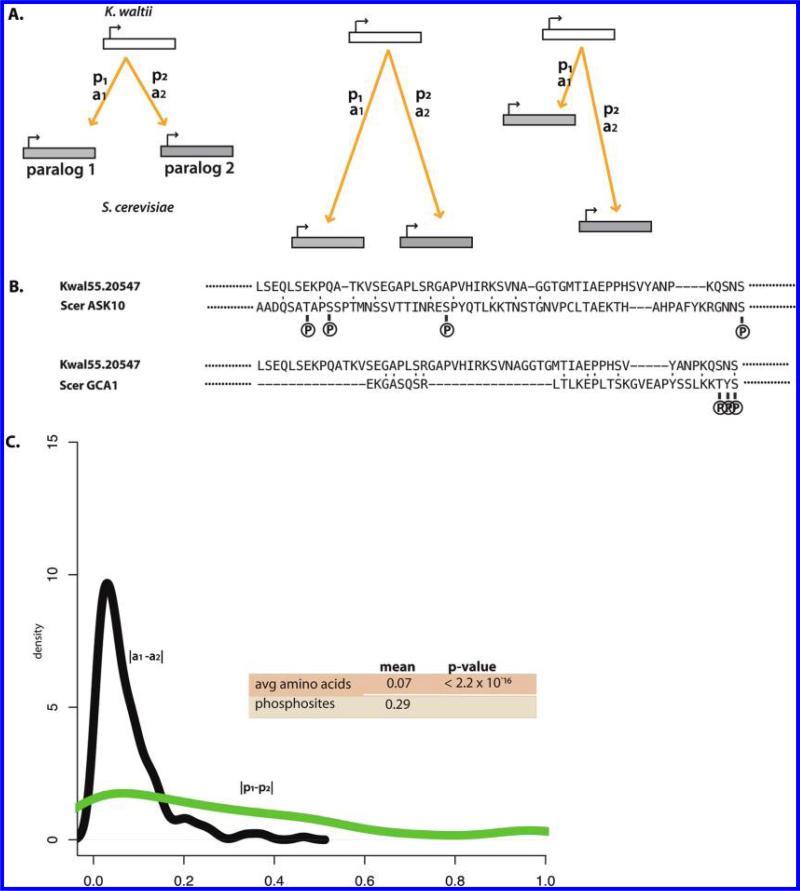
Gene duplication is a significant source of novel genes and the dynamics of gene duplicate retention vs loss are poorly understood, particularly in terms of the functional and regulatory specialization of their gene products. We compiled a comprehensive data set of S. cerevisiae phosphosites to study the role of phosphorylation in yeast paralog divergence. We found that proteins coded by duplicated genes created in the Whole Genome Duplication (WGD) event and in a period prior to the WGD are significantly more phosphorylated than other duplicates or singletons. Though the amino acid sequence of each paralog of a given pair tends to diverge fairly similarly from their common ortholog in a related species, the phosphorylated amino acids tend to diverge in sequence from the ortholog at different rates. We observed that transcription factors (TFs) are disproportionately present among the set of duplicate genes and among the set of proteins that are phosphorylated. Interestingly, TFs that occur on higher levels of the transcription network hierarchy (i.e., tend to regulate other TFs) tend to be more phosphorylated than lower-level TFs. We found that TF paralog divergence in expression, binding, and sequence correlates with the abundance of phosphosites. Overall, these studies have important implications for understanding divergence of gene function and regulation in eukaryotes.
Figures


Similar articles
-
Phosphorylation network rewiring by gene duplication.Mol Syst Biol. 2011 Jul 5;7:504. doi: 10.1038/msb.2011.43. Mol Syst Biol. 2011. PMID: 21734643 Free PMC article.
-
Curated collection of yeast transcription factor DNA binding specificity data reveals novel structural and gene regulatory insights.Genome Biol. 2011 Dec 21;12(12):R125. doi: 10.1186/gb-2011-12-12-r125. Genome Biol. 2011. PMID: 22189060 Free PMC article.
-
Differences in the number of intrinsically disordered regions between yeast duplicated proteins, and their relationship with functional divergence.PLoS One. 2011;6(9):e24989. doi: 10.1371/journal.pone.0024989. Epub 2011 Sep 15. PLoS One. 2011. PMID: 21949823 Free PMC article.
-
Regulation of RNA polymerase III transcription by Maf1 protein.Acta Biochim Pol. 2008;55(2):215-25. Epub 2008 Jun 17. Acta Biochim Pol. 2008. PMID: 18560610 Review.
-
Transcriptional networks: reverse-engineering gene regulation on a global scale.Curr Opin Microbiol. 2004 Dec;7(6):638-46. doi: 10.1016/j.mib.2004.10.009. Curr Opin Microbiol. 2004. PMID: 15556037 Review.
Cited by
-
Differential gene retention as an evolutionary mechanism to generate biodiversity and adaptation in yeasts.Sci Rep. 2015 Jun 25;5:11571. doi: 10.1038/srep11571. Sci Rep. 2015. PMID: 26108467 Free PMC article.
-
Where do phosphosites come from and where do they go after gene duplication?Int J Evol Biol. 2012;2012:843167. doi: 10.1155/2012/843167. Epub 2012 Jun 20. Int J Evol Biol. 2012. PMID: 22779031 Free PMC article.
-
Reciprocal phosphorylation of yeast glycerol-3-phosphate dehydrogenases in adaptation to distinct types of stress.Mol Cell Biol. 2012 Nov;32(22):4705-17. doi: 10.1128/MCB.00897-12. Epub 2012 Sep 17. Mol Cell Biol. 2012. PMID: 22988299 Free PMC article.
-
Evolutionary conservation of sequence motifs at sites of protein modification.J Biol Chem. 2023 May;299(5):104617. doi: 10.1016/j.jbc.2023.104617. Epub 2023 Mar 16. J Biol Chem. 2023. PMID: 36933807 Free PMC article.
-
Rethinking gene regulatory networks in light of alternative splicing, intrinsically disordered protein domains, and post-translational modifications.Front Cell Dev Biol. 2015 Feb 26;3:8. doi: 10.3389/fcell.2015.00008. eCollection 2015. Front Cell Dev Biol. 2015. PMID: 25767796 Free PMC article.
References
MeSH terms
Substances
Grants and funding
LinkOut - more resources
Full Text Sources
Molecular Biology Databases
Miscellaneous
