. 2012 May;36(5):759-67.
doi: 10.1111/j.1530-0277.2011.01681.x. Epub 2011 Dec 5.

Early growth response-1 contributes to steatosis development after acute ethanol administration

Affiliations

Early growth response-1 contributes to steatosis development after acute ethanol administration

Terrence M Donohue Jr et al. Alcohol Clin Exp Res. 2012 May.

Abstract

Background: Previous work demonstrated that the transcription factor, early growth response-1 (Egr-1), participates in the development of steatosis (fatty liver) after chronic ethanol (EtOH) administration. Here, we determined the extent to which Egr-1 is involved in fatty liver development in mice subjected to acute EtOH administration.

Methods: In acute studies, we treated both wild-type and Egr-1 null mice with either EtOH or phosphate-buffered saline (PBS) by gastric intubation. At various times after treatment, we harvested sera and livers and quantified endotoxin, indices of liver injury, steatosis, and hepatic Egr-1 content. In chronic studies, groups of mice were fed liquid diets containing either EtOH or isocaloric maltose-dextrin for 7 to 8 weeks.

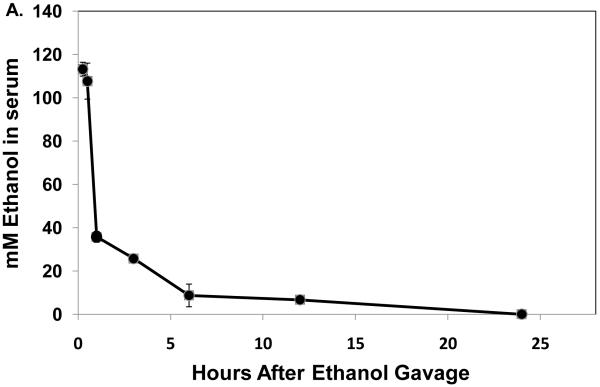
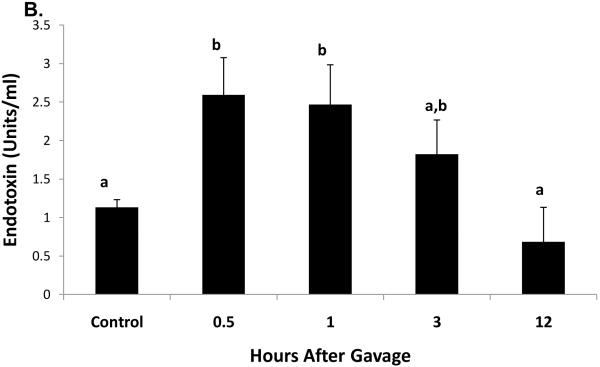
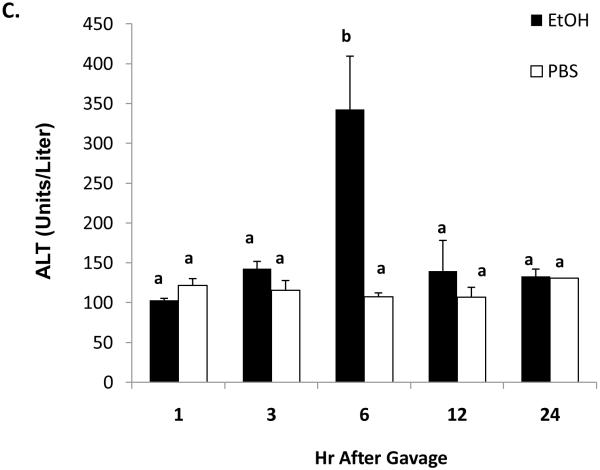
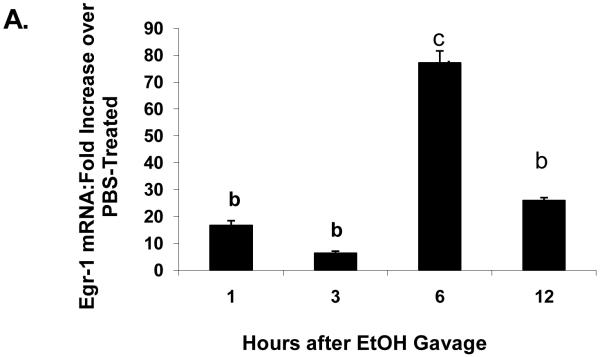
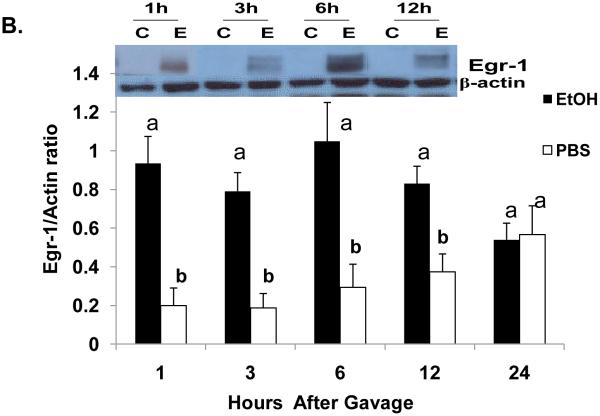
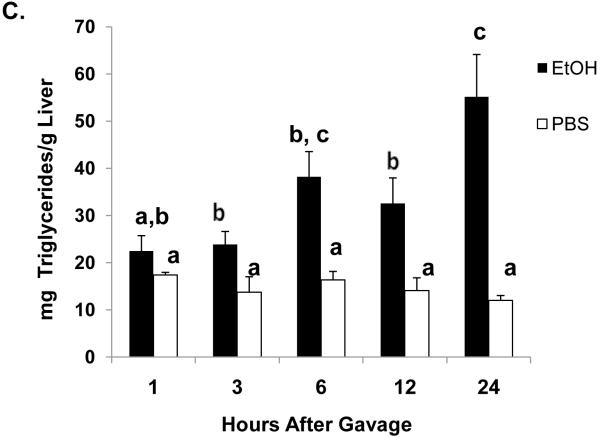
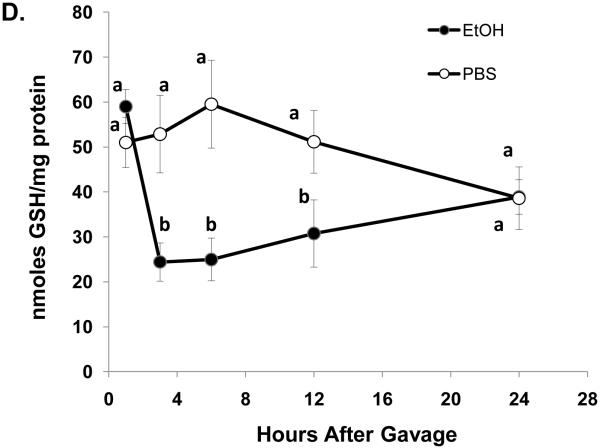
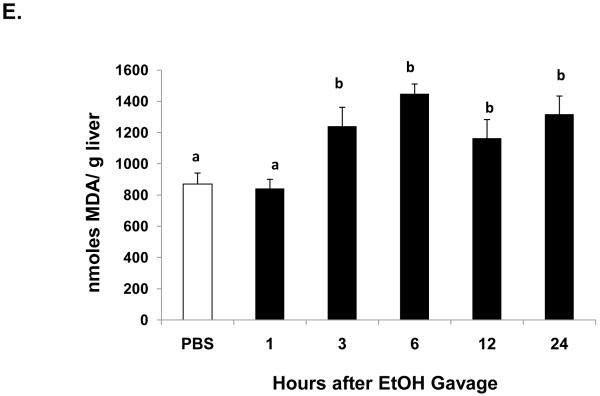
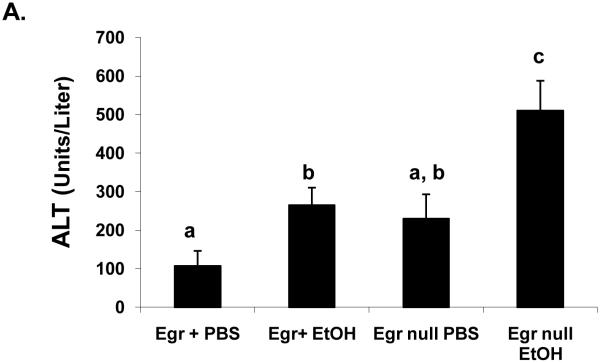
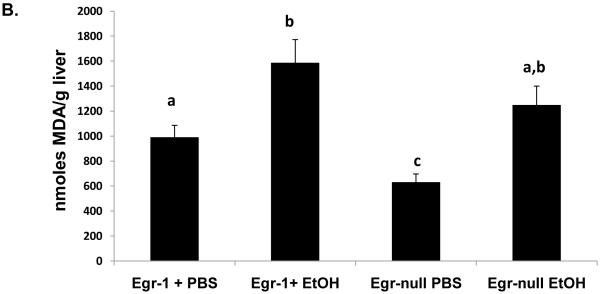
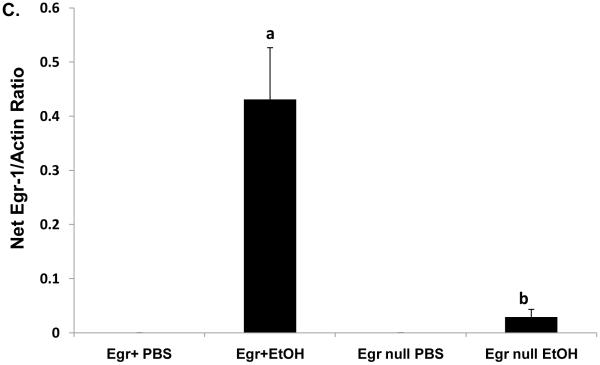
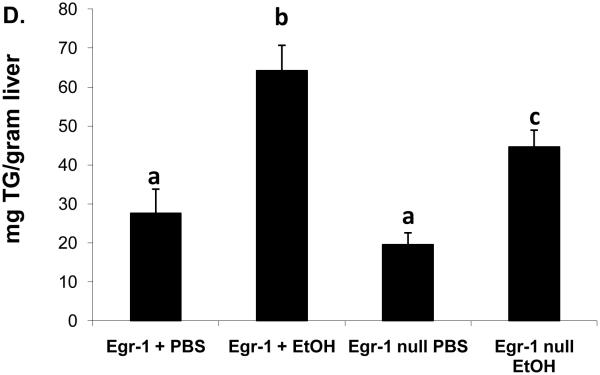
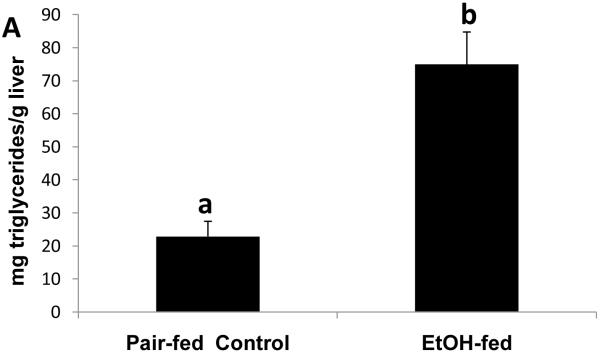
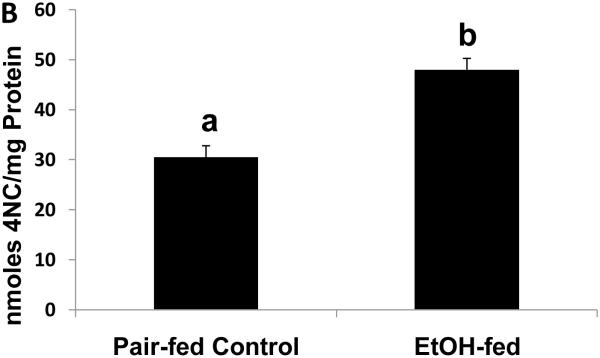
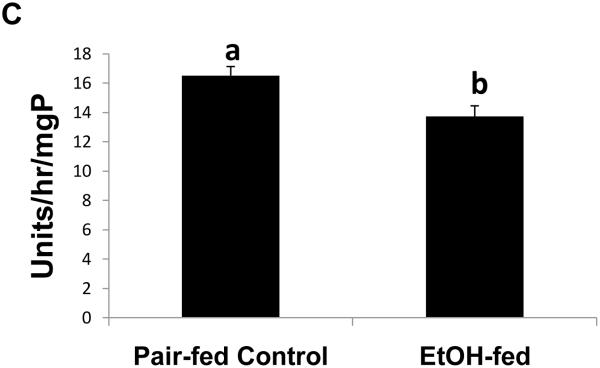
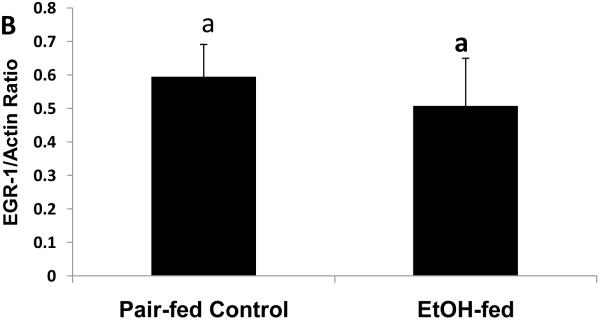
Results: Compared with controls, acute EtOH-treated mice showed a rapid, transient elevation in serum endotoxin beginning 30 minutes after treatment. One hour postgavage, livers from EtOH-treated mice exhibited a robust elevation of both Egr-1 mRNA and protein. By 3 hours postgavage, liver triglyceride increased in EtOH-treated mice as did lipid peroxidation. Acute EtOH treatment of Egr-1-null mice showed no Egr-1 expression, but these animals still developed elevated triglycerides, although significantly lower than EtOH-fed wild-type littermates. Despite showing decreased fatty liver, EtOH-treated Egr-1 null mice exhibited greater liver injury. After chronic EtOH feeding, steatosis and liver enlargement were clearly evident, but there was no indication of elevated endotoxin. Egr-1 levels in EtOH-fed mice were equal to those of pair-fed controls.

Conclusions: Acute EtOH administration induced the synthesis of Egr-1 in mouse liver. However, despite its robust increase, the transcription factor had a smaller, albeit significant, function in steatosis development after acute EtOH treatment. We propose that the rise in Egr-1 after acute EtOH is an hepatoprotective adaptation to acute liver injury from binge drinking that is triggered by EtOH metabolism and elevated levels of endotoxin.


Figures

Fig 1
Fig 1
Serum ethanol (panel A), serum endotoxin (panel B), and serum ALT (panel C) at the indicated times after a single standard dose of ethanol (6 grams/kg body wt) or PBS. Data presented are mean values (± SEM) from 2 to 10 animals per group per time point. Note: in Fig 1B, data from control animals (n=5) were compiled from sera of PBS-treated animals taken at 30 minutes and 3 hr post-gavage. Data with different letters indicate they are significantly different from each other. Data with the same letter are not significantly different.
Fig 1
Fig 1
Serum ethanol (panel A), serum endotoxin (panel B), and serum ALT (panel C) at the indicated times after a single standard dose of ethanol (6 grams/kg body wt) or PBS. Data presented are mean values (± SEM) from 2 to 10 animals per group per time point. Note: in Fig 1B, data from control animals (n=5) were compiled from sera of PBS-treated animals taken at 30 minutes and 3 hr post-gavage. Data with different letters indicate they are significantly different from each other. Data with the same letter are not significantly different.
Fig 2
Fig 2
Egr-1 mRNA level (panel A) Egr-1 protein level (panel B), hepatic triglycerides (panel C) reduced glutathione (Panel D), and lipid peroxides (panel E) at the indicated times after a single standard dose of ethanol (6 grams/kg body wt) or PBS. Data presented are mean values (± SEM) from 4 to 24 animals per group per time point. Symbols mean the same as in Fig 1. Note: In Fig 2A, the control values (each with an arbitrary value of 1) are not shown but are implied to have the symbol “a”. Thus, the values shown in Fig 2A begin with the symbol “b” or “c” as indicated. Inset panel in Fig 2B is a representative western blot of Egr-1 (80 KDa) and actin (42 KDa) in hepatic nuclear fractions from PBS-gavaged control (C) or ethanol-gavaged (E) C57Bl/6 mice.
Fig 2
Fig 2
Egr-1 mRNA level (panel A) Egr-1 protein level (panel B), hepatic triglycerides (panel C) reduced glutathione (Panel D), and lipid peroxides (panel E) at the indicated times after a single standard dose of ethanol (6 grams/kg body wt) or PBS. Data presented are mean values (± SEM) from 4 to 24 animals per group per time point. Symbols mean the same as in Fig 1. Note: In Fig 2A, the control values (each with an arbitrary value of 1) are not shown but are implied to have the symbol “a”. Thus, the values shown in Fig 2A begin with the symbol “b” or “c” as indicated. Inset panel in Fig 2B is a representative western blot of Egr-1 (80 KDa) and actin (42 KDa) in hepatic nuclear fractions from PBS-gavaged control (C) or ethanol-gavaged (E) C57Bl/6 mice.
Fig 3
Fig 3
Serum ALT activities (Panel A), lipid peroxides (Panel B), net Egr-1 levels (Panel C), and liver triglycerides (Panel D), in wild type and Egr-1 null mice 12 hr after a single standard dose of ethanol (6 grams/kg body wt) Data presented are mean values (± SEM) from 4 to 16 animals per group. Note: Data in Panel C were corrected by subtracting the background densities detected in PBS-treated animals from those of their corresponding wild type or Egr-1 null ethanol-treated mice. Data are expressed as the net intensity of the immunoreactive Egr-1 protein band and were normalized to that of β-actin. Symbols mean the same as in Fig 1.
Fig 3
Fig 3
Serum ALT activities (Panel A), lipid peroxides (Panel B), net Egr-1 levels (Panel C), and liver triglycerides (Panel D), in wild type and Egr-1 null mice 12 hr after a single standard dose of ethanol (6 grams/kg body wt) Data presented are mean values (± SEM) from 4 to 16 animals per group. Note: Data in Panel C were corrected by subtracting the background densities detected in PBS-treated animals from those of their corresponding wild type or Egr-1 null ethanol-treated mice. Data are expressed as the net intensity of the immunoreactive Egr-1 protein band and were normalized to that of β-actin. Symbols mean the same as in Fig 1.
Fig. 4
Fig. 4
Hepatic triglycerides (Panel A), CYP2E1 specific activity (Panel B), proteasome chymotrypsin-like specific activity (Panel C), and Egr-1 protein content (panel D) in livers of chronically ethanol-fed rats and their pair-fed controls after 39 to 60 days of pair-feeding. Data are expressed as mean values (± SEM) obtained from 4 to 6 mice per group. Symbols mean the same as in Fig 1.
Fig. 4
Fig. 4
Hepatic triglycerides (Panel A), CYP2E1 specific activity (Panel B), proteasome chymotrypsin-like specific activity (Panel C), and Egr-1 protein content (panel D) in livers of chronically ethanol-fed rats and their pair-fed controls after 39 to 60 days of pair-feeding. Data are expressed as mean values (± SEM) obtained from 4 to 6 mice per group. Symbols mean the same as in Fig 1.

Similar articles

Cited by

References

    1. Bae MH, Jeong CH, Kim SH, Bae MK, Jeong JW, Ahn MY, Bae SK, Kim ND, Kim CW, Kim KR, Kim KW. Regulation of Egr-1 by association with the proteasome component C8. Biochim Biophys Acta. 2002;1592(2):163–7. - PubMed
    1. Bardag-Gorce F, Oliva J, Dedes J, Li J, French BA, French SW. Chronic ethanol feeding alters hepatocyte memory which is not altered by acute feeding. Alcohol Clin Exp Res. 2009;33(4):684–92. - PMC - PubMed
    1. Buttkus H, Rose R. Amine malondialdehyde condensation products and their relative color contribution in the thiobarbituric acid test. J. Am Oil Chemists Soc. 1972;49:440–443.
    1. Carmiel-Haggai M, Cederbaum AI, Nieto N. Binge ethanol exposure increases liver injury in obese rats. Gastroenterology. 2003;125(6):1818–33. - PubMed
    1. Chen Q, Cederbaum AI. Cytotoxicity and apoptosis produced by cytochrome P450 2E1 in Hep G2 cells. Mol Pharmacol. 1998;53(4):638–48. - PubMed

Publication types

MeSH terms