

A Partial Least Squares based algorithm for parsimonious variable selection
- PMID: 22142365
- PMCID: PMC3287970
- DOI: 10.1186/1748-7188-6-27
A Partial Least Squares based algorithm for parsimonious variable selection
Abstract
Background: In genomics, a commonly encountered problem is to extract a subset of variables out of a large set of explanatory variables associated with one or several quantitative or qualitative response variables. An example is to identify associations between codon-usage and phylogeny based definitions of taxonomic groups at different taxonomic levels. Maximum understandability with the smallest number of selected variables, consistency of the selected variables, as well as variation of model performance on test data, are issues to be addressed for such problems.
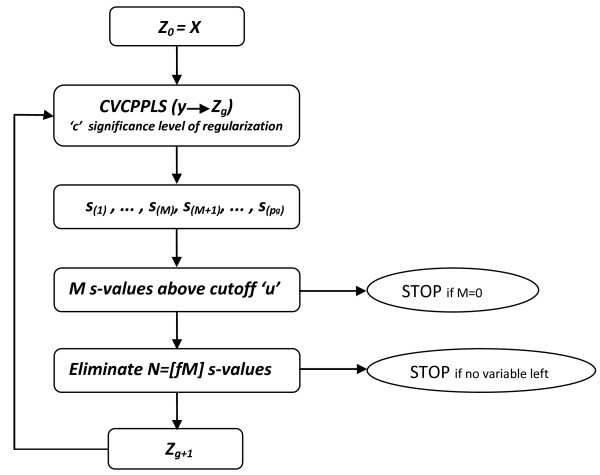
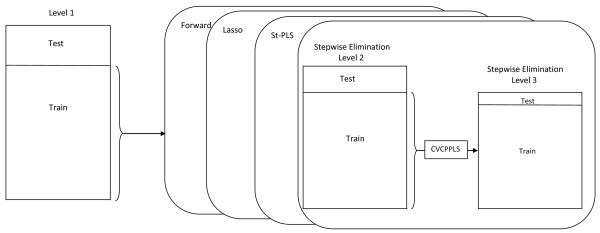
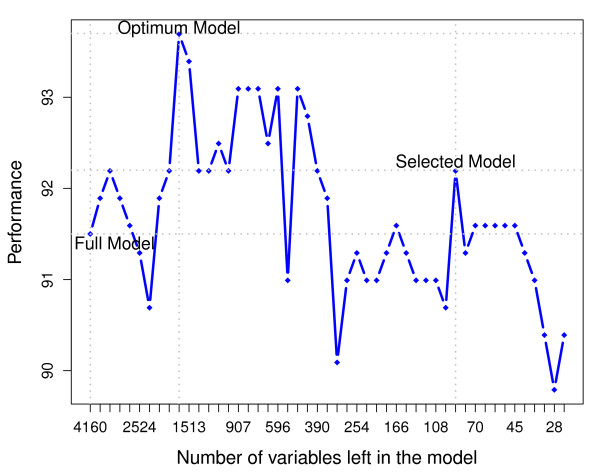
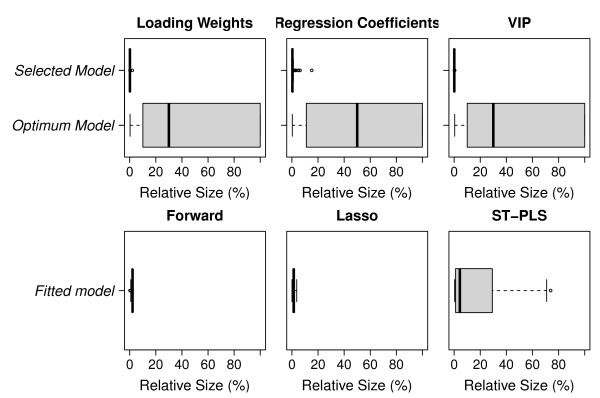
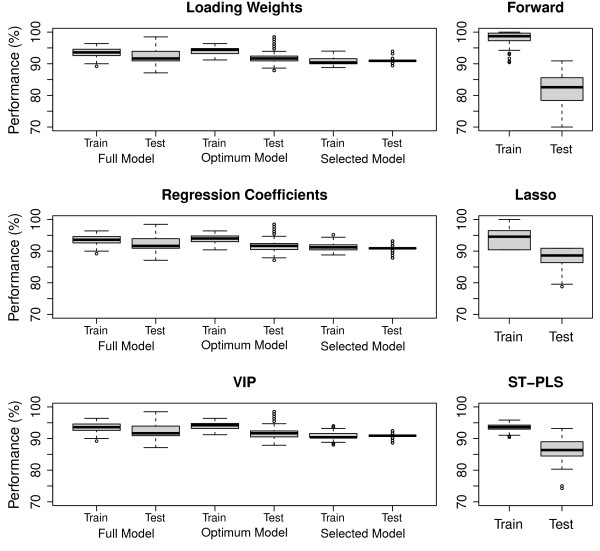
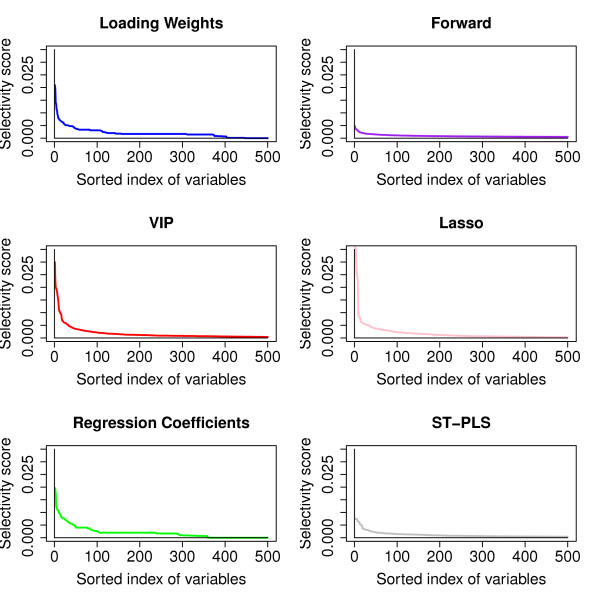
Results: We present an algorithm balancing the parsimony and the predictive performance of a model. The algorithm is based on variable selection using reduced-rank Partial Least Squares with a regularized elimination. Allowing a marginal decrease in model performance results in a substantial decrease in the number of selected variables. This significantly improves the understandability of the model. Within the approach we have tested and compared three different criteria commonly used in the Partial Least Square modeling paradigm for variable selection; loading weights, regression coefficients and variable importance on projections. The algorithm is applied to a problem of identifying codon variations discriminating different bacterial taxa, which is of particular interest in classifying metagenomics samples. The results are compared with a classical forward selection algorithm, the much used Lasso algorithm as well as Soft-threshold Partial Least Squares variable selection.
Conclusions: A regularized elimination algorithm based on Partial Least Squares produces results that increase understandability and consistency and reduces the classification error on test data compared to standard approaches.
Figures
Similar articles
-
Improved variable reduction in partial least squares modelling based on predictive-property-ranked variables and adaptation of partial least squares complexity.Anal Chim Acta. 2011 Oct 31;705(1-2):292-305. doi: 10.1016/j.aca.2011.06.037. Epub 2011 Jun 29. Anal Chim Acta. 2011. PMID: 21962372
-
Genetic algorithm interval partial least squares regression combined successive projections algorithm for variable selection in near-infrared quantitative analysis of pigment in cucumber leaves.Appl Spectrosc. 2010 Jul;64(7):786-94. doi: 10.1366/000370210791666246. Appl Spectrosc. 2010. PMID: 20615293
-
A bootstrapping soft shrinkage approach for variable selection in chemical modeling.Anal Chim Acta. 2016 Feb 18;908:63-74. doi: 10.1016/j.aca.2016.01.001. Epub 2016 Jan 7. Anal Chim Acta. 2016. PMID: 26826688
-
Variables selection methods in near-infrared spectroscopy.Anal Chim Acta. 2010 May 14;667(1-2):14-32. doi: 10.1016/j.aca.2010.03.048. Epub 2010 Mar 30. Anal Chim Acta. 2010. PMID: 20441862 Review.
-
Variable Screening for Near Infrared (NIR) Spectroscopy Data Based on Ridge Partial Least Squares Regression.Comb Chem High Throughput Screen. 2020;23(8):740-756. doi: 10.2174/1386207323666200428114823. Comb Chem High Throughput Screen. 2020. PMID: 32342803 Review.
Cited by
-
Contrasting signatures of genomic divergence during sympatric speciation.Nature. 2020 Dec;588(7836):106-111. doi: 10.1038/s41586-020-2845-0. Epub 2020 Oct 28. Nature. 2020. PMID: 33116308 Free PMC article.
-
Fecal microbiota composition of breast-fed infants is correlated with human milk oligosaccharides consumed.J Pediatr Gastroenterol Nutr. 2015 Jun;60(6):825-33. doi: 10.1097/MPG.0000000000000752. J Pediatr Gastroenterol Nutr. 2015. PMID: 25651488 Free PMC article.
-
Robust Wavelength Selection Using Filter-Wrapper Method and Input Scaling on Near Infrared Spectral Data.Sensors (Basel). 2020 Sep 3;20(17):5001. doi: 10.3390/s20175001. Sensors (Basel). 2020. PMID: 32899292 Free PMC article.
-
The glucose-lowering effect of low-dose diacerein and its responsiveness metabolic markers in uncontrolled diabetes.BMC Res Notes. 2022 Mar 4;15(1):91. doi: 10.1186/s13104-022-05974-9. BMC Res Notes. 2022. PMID: 35246243 Free PMC article. Clinical Trial.
-
An ensemble variable selection method for vibrational spectroscopic data analysis.RSC Adv. 2019 Feb 26;9(12):6708-6716. doi: 10.1039/c8ra08754g. eCollection 2019 Feb 22. RSC Adv. 2019. PMID: 35548689 Free PMC article.
References
-
- Bachvarov B, Kirilov K, Ivanov I. Codon usage in prokaryotes. Biotechnology and Biotechnological Equipment. 2008;22(2):669.
-
- Hastie T, Tibshirani R, Friedman J. The Elements of Statistical Learning. 2008.
LinkOut - more resources
Full Text Sources
