. 2011 Nov 15;10(22):3964-72.
doi: 10.4161/cc.10.22.18150. Epub 2011 Nov 15.

Centrin depletion causes cyst formation and other ciliopathy-related phenotypes in zebrafish

Affiliations

Centrin depletion causes cyst formation and other ciliopathy-related phenotypes in zebrafish

Benedicte Delaval et al. Cell Cycle. .

Abstract

Most bona fide centrosome proteins including centrins, small calcium-binding proteins, participate in spindle function during mitosis and play a role in cilia assembly in non-cycling cells. Although the basic cellular functions of centrins have been studied in lower eukaryotes and vertebrate cells in culture, phenotypes associated with centrin depletion in vertebrates in vivo has not been directly addressed. To test this, we depleted centrin2 in zebrafish and found that it leads to ciliopathy phenotypes including enlarged pronephric tubules and pronephric cysts. Consistent with the ciliopathy phenotypes, cilia defects were observed in differentiated epithelial cells of ciliated organs such as the olfactory bulb and pronephric duct. The organ phenotypes were also accompanied by cell cycle deregulation namely mitotic delay resulting from mitotic defects. Overall, this work demonstrates that centrin2 depletion causes cilia-related disorders in zebrafish. Moreover, given the presence of both cilia and mitotic defects in the affected organs, it suggests that cilia disorders may arise from a combination of these defects.


Figures
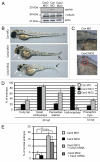
Figure 1
Figure 1
Centrin2-depleted zebrafish embryos exhibit gross anatomical features of ciliopathies. (A) Immunoblot from lysates of control (Con) or centrin2 (Cen2) morphants probed for centrin, γ tubulin and actin antibodies shows loss of centrin2 protein in centrin2 morphants (Cen2 MO1 and MO2). Actin and γ tubulin, loading controls. (B) Control and centrin2 morphants 48 h post fertilization (48 hpf). Defects in centrin2 morphants include smaller eyes (white arrows), curly tails (black arrows), pericardiac edema (white arrowheads) and hydrocephaly (black arrowhead). (C) Cyst in the proximal region of the pronephric duct (red line around cyst) in 72 hpf centrin2 morphant (lower part) compared with control (upper part). (D) Quantification of defects in centrin2 morphants compared with control. p < 0.01 unless otherwise stated. ns, p-value not significant. (E) Quantification of centrin morphants (Morpholino, MO1 and MO2) with defects after complementation with zebrafish centrin2 mRNA. Error bars, mean of three independent experiments ± SD (n > 50 embryo). *p < 0.05 and **p < 0.01.
Figure 2
Figure 2
Centrin2 depletion in zebrafish embryos leads to enlarged pronephric ducts. (A) Quantification of 48 hpf embryos with enlarged pronephric ducts. Error bars represent an average of three independent experiments ± SD (n > 25 fish); p < 0.001. (B) Schematic showing region of the duct imaged in (C) (red line) and position of cross-sections used in (D) (red arrow). (C) Whole mount embryos stained by immunofluorescence for Na+ K+ ATPase (pronephric duct marker, green) and γ tubulin (centrosome, red); shown are maximum projections from stacks of confocal images. Dotted line indicates duct border. Diameter of the duct is shown in upper right corner. Scale bar, 10 µm. Insets (below), single plane images and enlargements showing cell disorganization and diffuse Na+ K+ ATPase marker in centrin2 morphants compared with control. (D) Electron micrographs showing crosssections of proximal pronephric duct regions in control (upper left) and centrin2 morphants (upper right). Enlargements (lower parts) show decreased number of cilia (cross-section) in the pronephric tubule lumen of centrin2 morphant (right) compared with control (left). Note: similar magnifications; red line indicates duct border.
Figure 3
Figure 3
Centrin2 localization in ciliated tissues. (A) Schematic showing the olfactory organ, distal pronephric duct and spinal cord. (B) Centrin and γ tubulin localization in these tissues. White line, pronephric duct lumen and central canal of spinal cord.
Figure 4
Figure 4
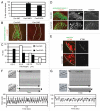
Centrin2 depletion in zebrafish leads to cilia defects. (A) Quantification of centrin2 morphants with cilia defects (stained as in B). Error bars, average of three independent experiments ± SD (n = 25 fish). p < 0.001. (B) Immunofluorescence images of the distal pronephric duct (cloaca region) of whole mount 48 hpf zebrafish embryos, stained for cilia (acetylated tubulin, green) and centrosomes (γ tubulin, red); white lines, lumen border. Fewer cilia are observed in centrin2 morphants. Scale bar, 10 µm. (C) Quantification of cilia length in the distal region of the pronephric duct (n = 30 individual cilia measured from at least three different embryos; stained as in D). Immunofluorescence stainning: α tubulin, cilia marker. (D) Immunofluorescence images of the olfactory organ of whole mount control and centrin2 zebrafish embryos stained for cilia and centrosomes as in (B) showing cilia defects in the olfactory organ of centrin2 morphant compared with control. Arrow, cilia; arrowhead, shorter cilia. (E) Immunofluorescence images of whole mount embryos showing cilia (acetylated tubulin, red) and IFT88 (green) in the olfactory organ. Basal body-associated IFT88 is reduced in centrin2 morphant compared with control. White line, edge of the olfactory pit. (F) Still frames from videos (left, upper and lower), kymograph (right, upper and lower) and corresponding plot (bottom part) of cilia movement in the proximal pronephric duct of control embryo. The position of the line used to create the kymograph along the tubule (upper left) and across the tubule (lower left) is indicated by the white line on the corresponding still frame. Arrowhead indicates the part of the kymograph used for the corresponding plot; the dotted black line outlines lumen of the duct. (G) Same as (F). for centrin2 morphant. All cilia analysis were done in 48 hpf embryos.
Figure 5
Figure 5
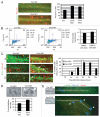
Centrin2 depletion in zebrafish leads to mitotic defects and a delay in mitosis. (A) Immunofluorescence images of phospho-histone H3-positive cells (red) in the tail of control and centrin2 morphants. α tubulin, green. Quantification of phos-H3 positive cells in control and centrin2 morphants (right). p < 0.01. 48 hpf embryos. (B) Dot plots showing cell cycle analysis by flow cytometry analysis of cells from 48 hpf dissociated embryos stained for propidium iodide (PI) and phospho-histone H3 (phos-H3). Graph (right): fold increase in mitotic cells (phos-H3-positive and PI positive; Q3) and cells with DNA content > 2N in centrin2 morphants compared with control; average of three independent experiments ± SD, n = 30 dissociated embryos. n > 20,000 cells. (C) Immunofluoresence images of the tail of control and centrin2 morphants stained with anti-BrdU (green) and anti-phos-H3 (red) at selected time points (T, h) after BrdU incorporation. Quantification (right), time course of mitotic cell progressing from S phase into and out of G2/M as shown by BrdU incorporation followed by double phos-H3/BrdU staining at varying time points post-incorporation. Control shows peak colocalization (entry in mitosis) 6 h after BrdU pulse. Centrin2 MO shows peak colocalization 6 h after pulse, but, in contrast to control colocalization, remains even 10 h after BrdU pulse indicating a delay in exiting mitosis. Brdu incorporation done on 32 hpf embryos. (D) Toluidine blue staining of longitudinal histological sections of embryos showing mitotic cells with condensed DNA. Well-congressed chromosomes on metaphase plates in control embryos compared with prometaphase-like chromosome configurations in centrin2 morphants. Graph, prevalence of prometaphase-like cells in histological sections of 48 hpf embryos. n > 100 mitotic cells/fish. Average of three independent experiments ± SD p < 0.01. (E) Immunofluorescence images of the the spinal cord (tail bud region, inset) of whole mount embryos showing α tubulin (green), γ tubulin (red) and phos-H3 (blue) of control or centrin2 morphants. Mitotic cells (arrows) accumulate in the defective organs in centrin2-depleted embryos (48 hpf). White line, straight tail of control or downward curving tail of centrin2 morphant.

Comment in

  • Many defects make a cyst.
    Shah JV. Shah JV. Cell Cycle. 2012 Jan 1;11(1):16. doi: 10.4161/cc.11.1.18732. Epub 2012 Jan 1. Cell Cycle. 2012. PMID: 22193033 No abstract available.

Similar articles

Cited by

References

    1. Hildebrandt F, Otto E. Cilia and centrosomes: a unifying pathogenic concept for cystic kidney disease? Nat Rev Genet. 2005;6:928–940. doi: 10.1038/nrg1727. - DOI - PubMed
    1. Robert A, Margall-Ducos G, Guidotti JE, Bregerie O, Celati C, Brechot C, et al. The intraflagellar transport component IFT88/polaris is a centrosomal protein regulating G1-S transition in non-ciliated cells. J Cell Sci. 2007;120:628–637. doi: 10.1242/jcs.03366. - DOI - PubMed
    1. Delaval B, Bright A, Lawson ND, Doxsey S. The cilia protein IFT88 is required for spindle orientation in mitosis. Nat Cell Biol. 2011;13:461–468. doi: 10.1038/ncb2202. - DOI - PMC - PubMed
    1. Zhang J, Wu M, Wang S, Shah JV, Wilson PD, Zhou J. Polycystic kidney disease protein fibrocystin localizes to the mitotic spindle and regulates spindle bipolarity. Hum Mol Genet. 2010;19:3306–3319. doi: 10.1093/hmg/ddq233. - DOI - PMC - PubMed
    1. Krämer A, Lukas J, Bartek J. Checking out the centrosome. Cell Cycle. 2004;3:1390–1393. doi: 10.4161/cc.3.11.1252. - DOI - PubMed

Publication types

LinkOut - more resources