. 2012 Feb 1;362(1):11-23.
doi: 10.1016/j.ydbio.2011.10.036. Epub 2011 Nov 18.

Differential regulation of epiboly initiation and progression by zebrafish Eomesodermin A

Affiliations

Differential regulation of epiboly initiation and progression by zebrafish Eomesodermin A

Susan Du et al. Dev Biol. .

Abstract

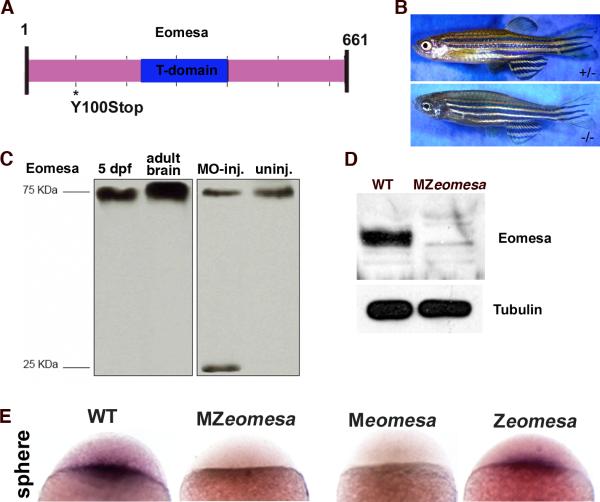
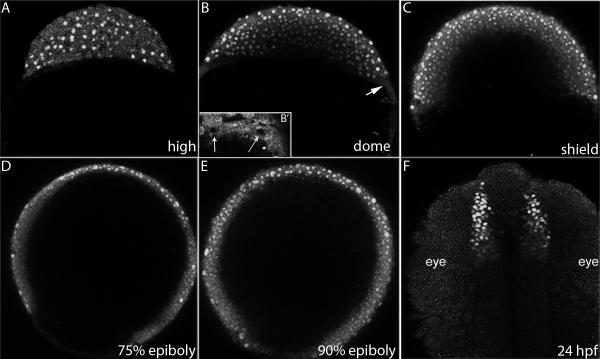
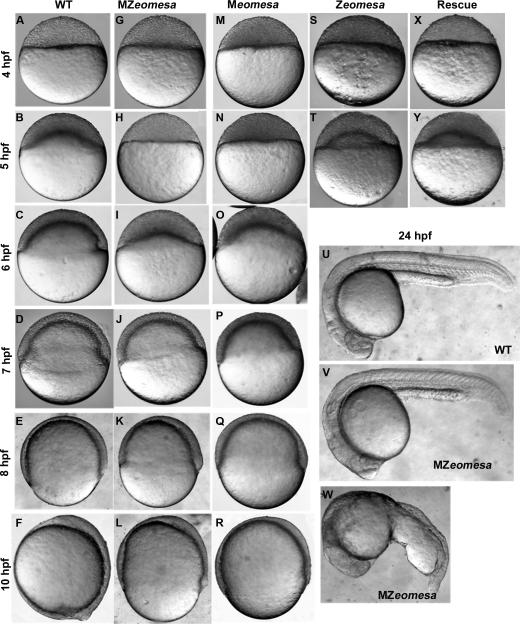
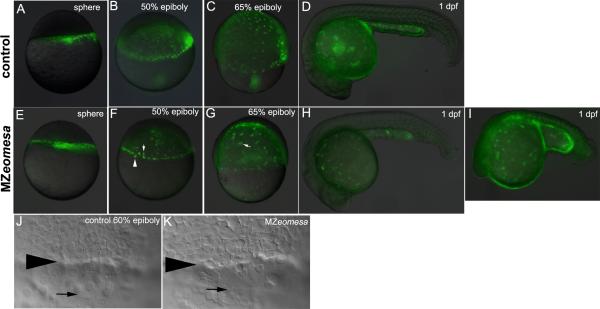
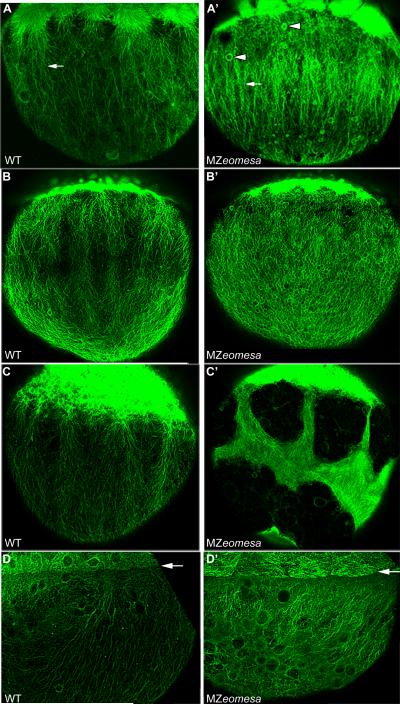
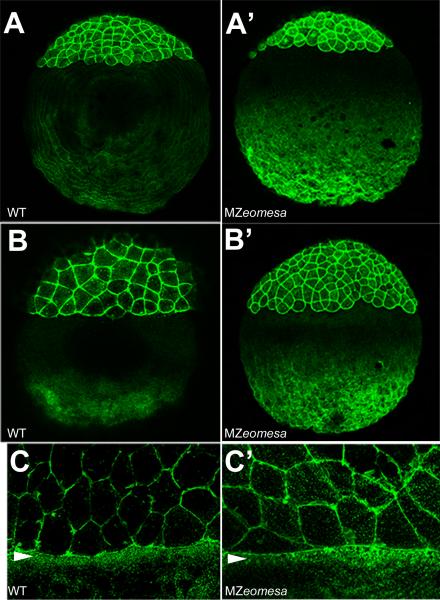
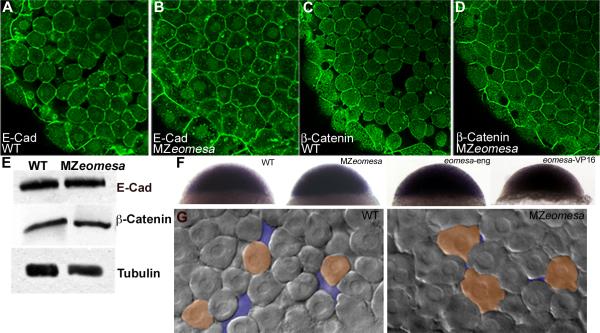
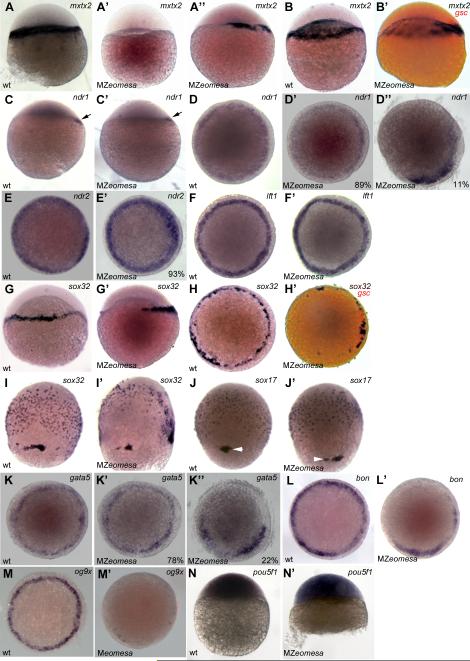
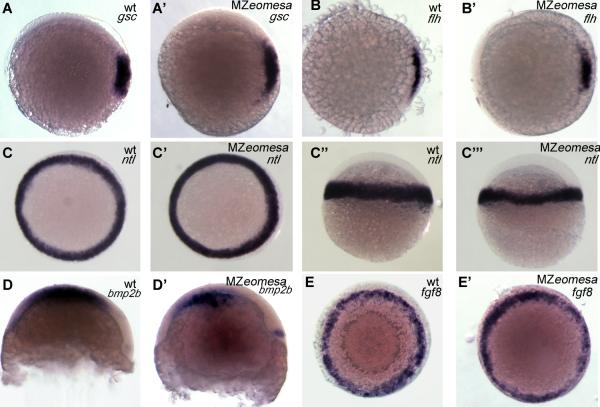
The T-box transcription factor Eomesodermin (Eomes) has been implicated in patterning and morphogenesis in frog, fish and mouse. In zebrafish, one of the two Eomes homologs, Eomesa, has been implicated in dorsal-ventral patterning, epiboly and endoderm specification in experiments employing over-expression, dominant-negative constructs and antisense morpholino oligonucleotides. Here we report for the first time the identification and characterization of an Eomesa mutant generated by TILLING. We find that Eomesa has a strictly maternal role in the initiation of epiboly, which involves doming of the yolk cell up into the overlying blastoderm. By contrast, epiboly progression is normal, demonstrating for the first time that epiboly initiation is genetically separable from progression. The yolk cell microtubules, which are required for epiboly, are defective in maternal-zygotic eomesa mutant embryos. In addition, the deep cells of the blastoderm are more tightly packed and exhibit more bleb-like protrusions than cells in control embryos. We postulate that the doming delay may be the consequence both of overly stabilized yolk cell microtubules and defects in the adhesive properties or motility of deep cells. We also show that Eomesa is required for normal expression of the endoderm markers sox32, bon and og9x; however it is not essential for endoderm formation.


Figures

Figure 1
Figure 1. eomesafh105 mutant allele
Schematic of the 661 amino acid full-length Eomesa protein with T-domain in blue. Location of the stop codon in allele fh105 marked by asterisk. (B) Images of heterozygous (top) and homozygous (bottom) eomesafh105 adult fish. (C) Control western blot for the anti-Eomesa antibody, lanes as indicated. (D)Western blot of sphere stage wild type and MZeomesa embryos, lanes as indicated. 15 embryo equivalents loaded per lane. (E) Whole-mount in situ hybridization for eomesa on sphere stage embryos of the indicated genotypes.
Figure 2
Figure 2. Eomesa protein distribution
Confocal projections of embryos stained with anti-Eomesa antibody. (A-E) lateral views (F) dorsal view. Stages indicated in lower right. Arrow in (B) indicates the YSL. (B’) Inset shows YSL of embryo at sphere stage. Arrows indicate unstained YSL-nuclei that are surrounding by Eomesa positive YSL cytoplasm.
Figure 3
Figure 3. Phenotypes of MZeomesa, Meomesa and Zeomesa mutant embryos
Lateral views of live embryos, stages and genotypes as indicated. Doming is delayed in MZeomesa (H) and Meomesa (N) but not Zeomesa embryos (T). (X, Y) Injection of eomesa-VP16 rescues the timing of epiboly initiation.
Figure 4
Figure 4. Epiboly progression is normal in MZeomesa embryos
(A-I) Overlays of fluorescent and brighfield images of control (A-D) and MZeomesa (E-I) embryos injected into the YSL with fluorescent histone to highlight the YSN. Stages as indicated. (F) Arrowhead and arrow indicate abnormally large and small nuclei, respectively. (G) Arrow indicates cluster of clumped nuclei not visible in the control embryo in (C). Wild type (H) and abnormal looking (I) MZeomesa embryos at 1 dpf have intact YSLs (J,K) DIC images of the margin of 60% epiboly control (J) and MZeomesa (K) embryo. Arrowhead indicates deep cell margin, arrow indicates EVL margin.
Figure 5
Figure 5. Yolk cell microtubules are altered in MZeomesa embryos
Confocal projections of lateral views of wild type (A-D) and MZeomesa (A’-D’) embryos stained for Tubulin. (A, A’) High stage, (B, B’) sphere stage (C, C’) dome stage, (D, D’) 75% epiboly. (A, A’) Arrows indicate longitudinal microtubule arrays. Arrowheads indicate spherical structures in MZeomesa embryo. (D, D’) arrows indicate blastoderm-yolk cell boundary.
Figure 6
Figure 6. The actin cytoskeleton is normal is MZeomesa embryos
Confocal projections of lateral views of phalloidin stained embryos. (A-C) wild type and (A’-C’) MZeomesa embryos. (A, A’) sphere stage (B, B’) dome stage, (C, C’) close up of marginal region at 75% epiboly, arrowheads indicate actin band in the YSL.
Figure 7
Figure 7. Cell morphology is altered in MZeomesa embryos
(A-D) Confocal images of embryos at sphere stage stained for Cdh1 (A,B) and β-Catenin (C,D). (E) Western blot of wild type (lane 1) and MZeomesa mutant embryo (lane 2) sphere stage extracts. Levels of Cdh1 and β -Catenin are not obviously altered in mutant embryos. (F) Normal cdh1 expression in sphere stage wild type, MZeomesa, eomesa-eng and eomesa-VP16 injected wild type embryos, as indicated. (G) Live DIC images of wild type and MZeomesa embryos at sphere stage. Mutant cells are more tightly packed and exhibit more blebs then wild type cells. Orange highlights selected cell morphologies, purple highlights intercellular space.
Figure 8
Figure 8. Expression of endoderm markers is reduced in MZeomesa embryos
(A-C’, G, G’, I-J’) lateral views, (D-F’, H, H’, K-M’) animal pole views of embryos stained by whole mount in situ hybridzation. (A-B’) mxtx2 expression at sphere (A-A’’) and dome stage. (B’) gsc in red marks dorsal. (C-D’’) ndr1 expression at sphere (arrow, C,C’) and 40% epiboly (D-D’’). (E, E’) ndr2 expression at 40% epiboly. (F,F’) lft1 expression at 40% epiboly (G-H’) sox32 expression at 40% epiboly, (H’) gsc in red marks dorsal. sox32 expression (I,I’) and sox17 expression (J,J’) at 75% epiboly. Arrowheads indicate dorsal forerunner cells. (K-K’’) gata5 expression at 40% epiboly. (L,L’) bon expression at 40% epiboly (M,M’) og9x expression at 40% epiboly. (N.N’) pou5f1 at oblong/sphere. Genotypes indicated in lower left, probe in upper right and percentages of embryos that exhibited given phenotype shown in lower right where appropriate.
Figure 9
Figure 9. Expression of mesodermal markers is normal in MZeomesa embryos
(A-C’, E, E’) animal pole views (C-C’’, D, D’) lateral views. Genotypes and markers as indicated in upper right.

Similar articles

Cited by

References

    1. Abrams EW, Mullins MC. Early zebrafish development: it's in the maternal genes. Curr. Opin. Genet. Dev.. 2009;19:396–403. - PMC - PubMed
    1. Alexander J, Rothenberg M, Henry GL, Stainier DY. casanova plays an early and essential role in endoderm formation in zebrafish. Dev. Biol. 1999;215:343–357. - PubMed
    1. Alexander J, Stainier DY. A molecular pathway leading to endoderm formation in zebrafish. Curr. Biol. 1999;9:1147–1157. - PubMed
    1. Arnold SJ, Hofmann UK, Bikoff EK, Robertson EJ. Pivotal roles for eomesodermin during axis formation, epithelium-to-mesenchyme transition and endoderm specification in the mouse. Development. 2008;135:501–511. - PMC - PubMed
    1. Babb SG, Marrs JA. E-cadherin regulates cell movements and tissue formation in early zebrafish embryos. Dev. Dyn. 2004;230:263–277. - PubMed

Publication types

MeSH terms