

Bayesian analysis on meta-analysis of case-control studies accounting for within-study correlation
- PMID: 22143403
- PMCID: PMC3683108
- DOI: 10.1177/0962280211430889
Bayesian analysis on meta-analysis of case-control studies accounting for within-study correlation
Abstract
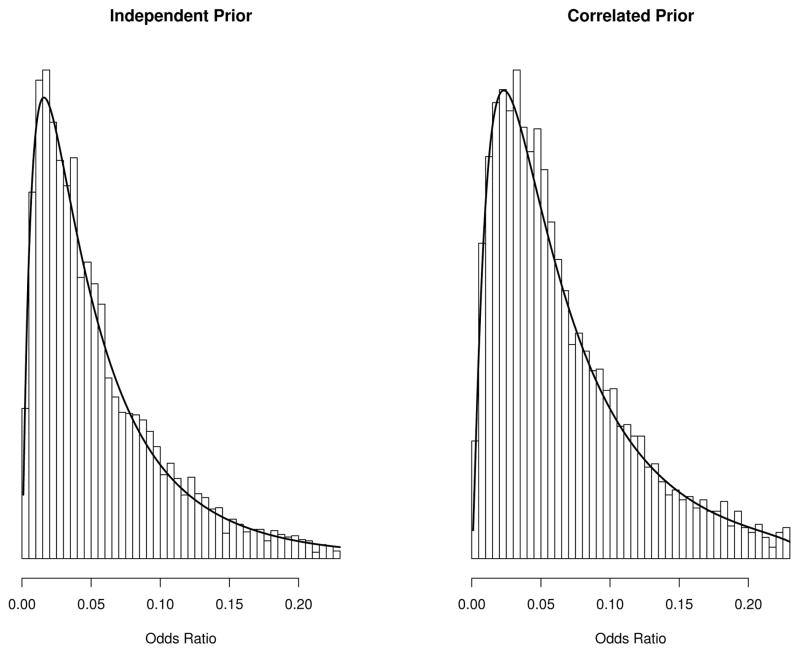
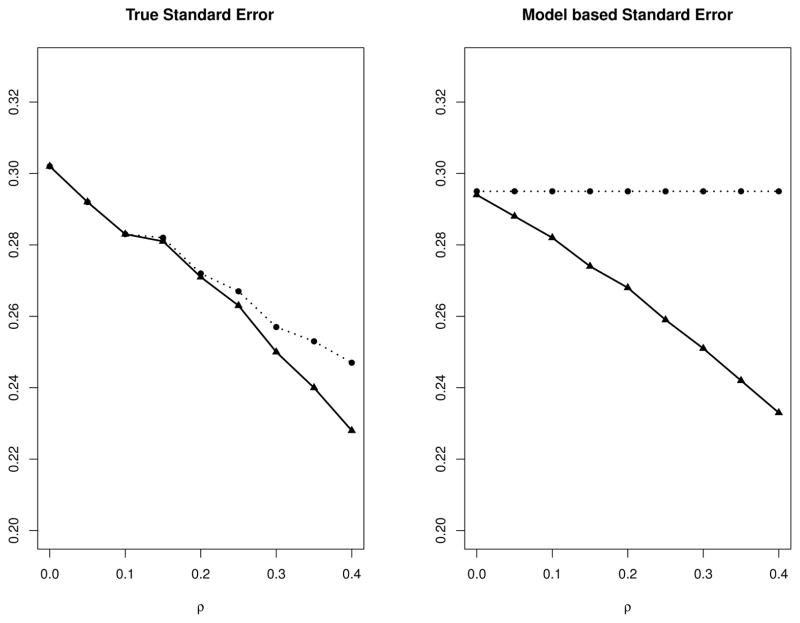
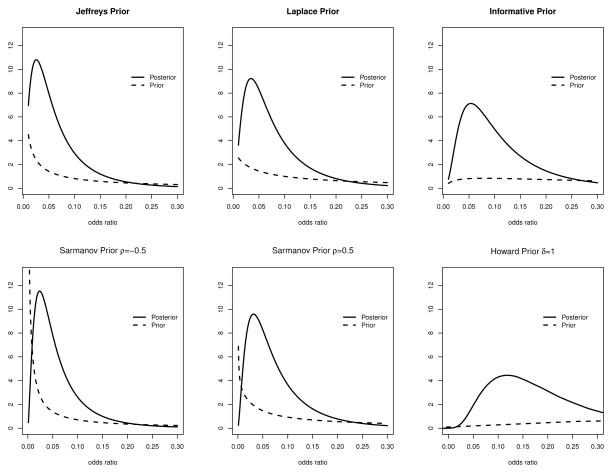
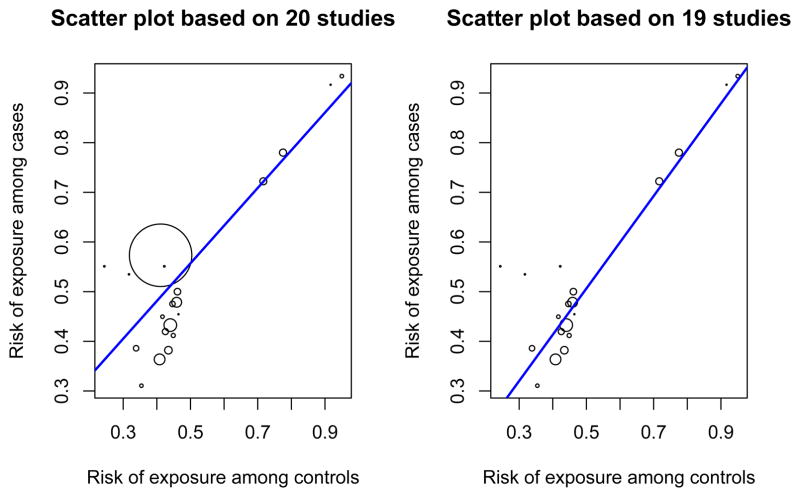
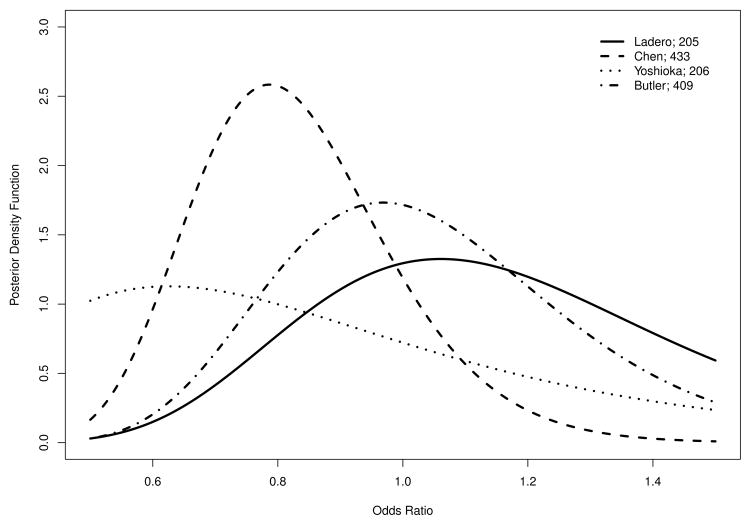
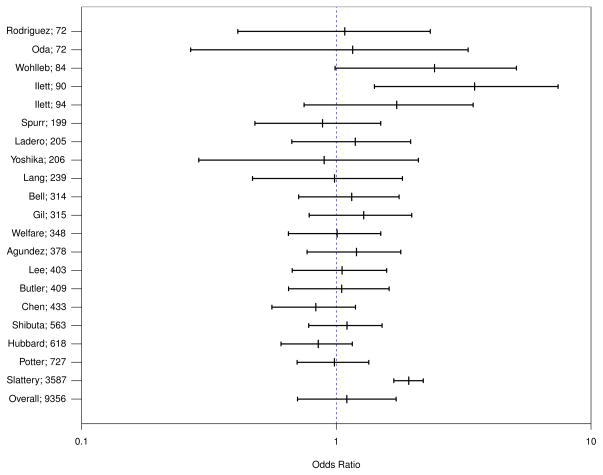
In retrospective studies, odds ratio is often used as the measure of association. Under independent beta prior assumption, the exact posterior distribution of odds ratio given a single 2 × 2 table has been derived in the literature. However, independence between risks within the same study may be an oversimplified assumption because cases and controls in the same study are likely to share some common factors and thus to be correlated. Furthermore, in a meta-analysis of case-control studies, investigators usually have multiple 2 × 2 tables. In this article, we first extend the published results on a single 2 × 2 table to allow within study prior correlation while retaining the advantage of closed-form posterior formula, and then extend the results to multiple 2 × 2 tables and regression setting. The hyperparameters, including within study correlation, are estimated via an empirical Bayes approach. The overall odds ratio and the exact posterior distribution of the study-specific odds ratio are inferred based on the estimated hyperparameters. We conduct simulation studies to verify our exact posterior distribution formulas and investigate the finite sample properties of the inference for the overall odds ratio. The results are illustrated through a twin study for genetic heritability and a meta-analysis for the association between the N-acetyltransferase 2 (NAT2) acetylation status and colorectal cancer.
Keywords: Sarmanov family; bivariate beta-binomial model; exact method; hypergeometric function; meta-analysis; odds ratio.
© The Author(s) 2011.
Figures
References
-
- Brown LD, Cai TT, DasGupta A. Interval estimation for a binomial proportion. Statistical Science. 2001;16(2):101–133.
-
- Haldane BJBS. The estimation and significance of the logarithm of a ratio of frequencies. Annals of Human Genetics. 1955;20(4):309–311. - PubMed
-
- Anscombe F. On estimating binomial response relations. Biometrika. 1956;43(3–4):461.
-
- Agresti A. On logit confidence intervals for the odds ratio with small samples. Biometrics. 1999;55(2):597–602. - PubMed
-
- Sweeting MJ, Sutton AJ, Lambert PC. What to add to nothing? Use and avoidance of continuity corrections in meta-analysis of sparse data. Statistics in medicine. 2004;23(9):1351–1375. - PubMed
Publication types
MeSH terms
Substances
Grants and funding
LinkOut - more resources
Full Text Sources
Medical
