

p53 negatively regulates the osteogenic differentiation of vascular smooth muscle cells in mice with chronic kidney disease
- PMID: 22143460
- PMCID: PMC3734878
- DOI: 10.5830/CVJA-2011-069
p53 negatively regulates the osteogenic differentiation of vascular smooth muscle cells in mice with chronic kidney disease
Abstract
Aim: To investigate the osteogenic differentiation of vascular smooth muscle cells (VSMCs) in mice with chronic kidney disease (CKD) and to evaluate the effects of p53 on the osteogenic differentiation of the VSMCs.
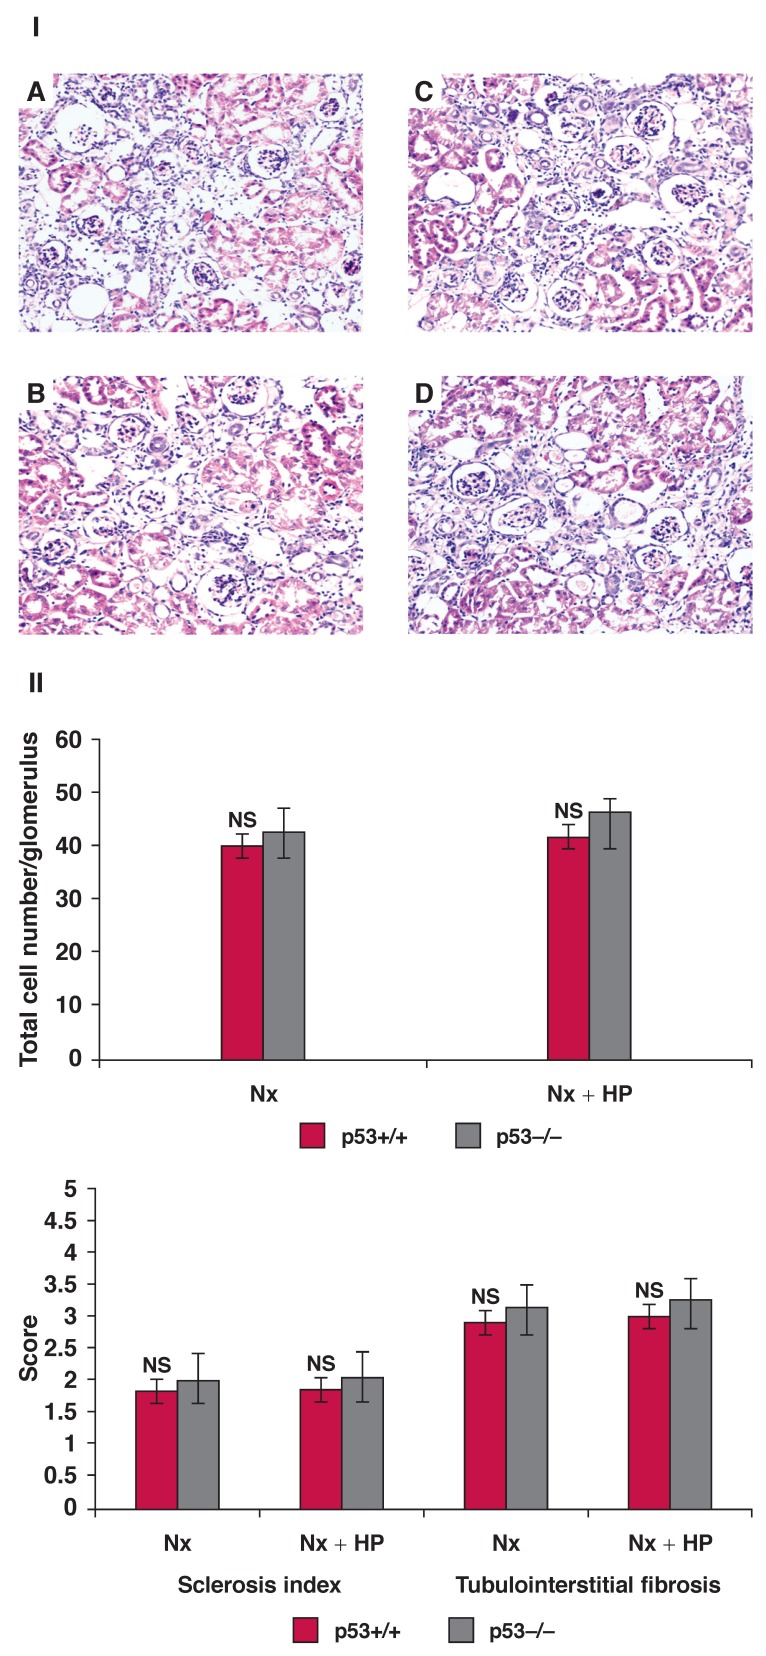
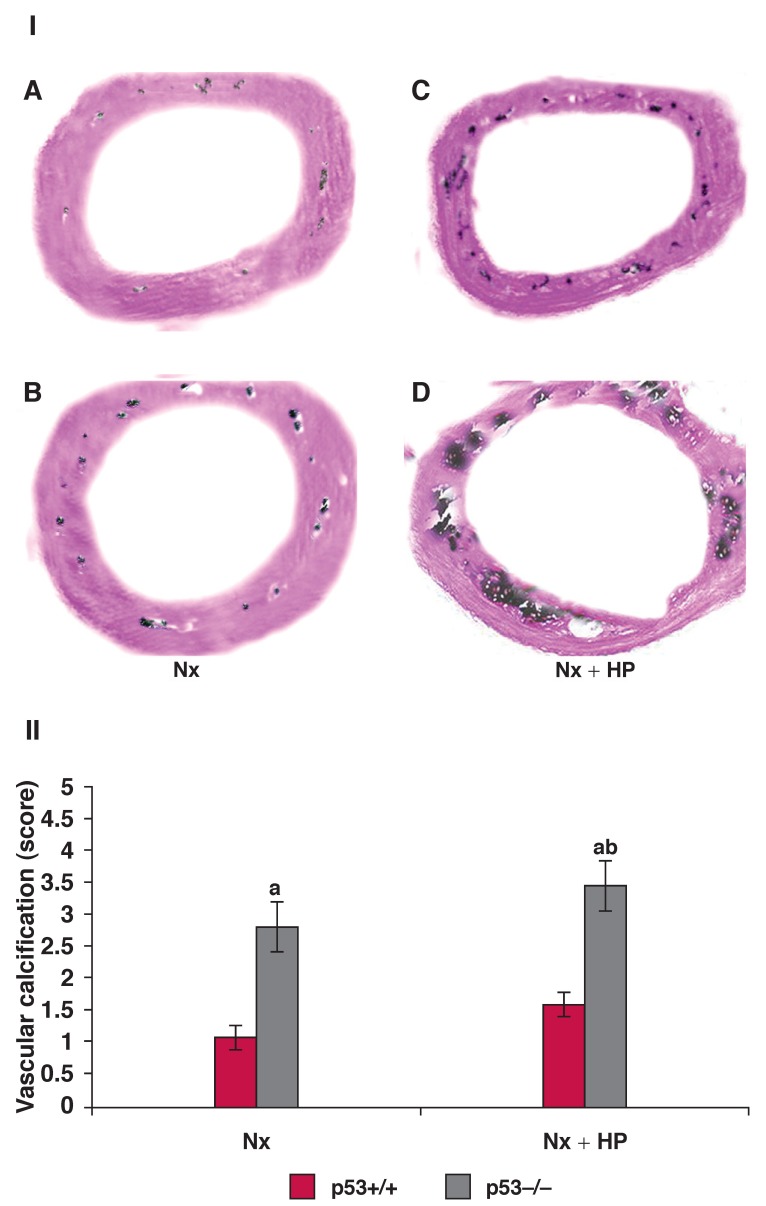
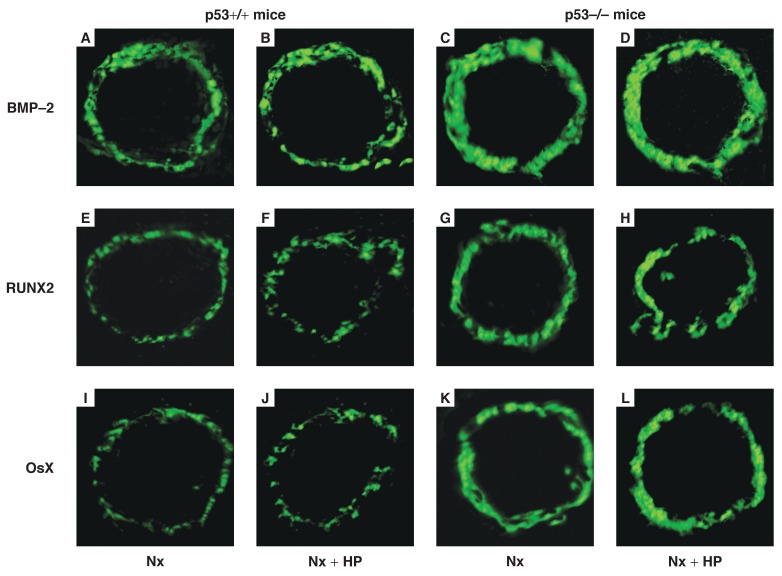
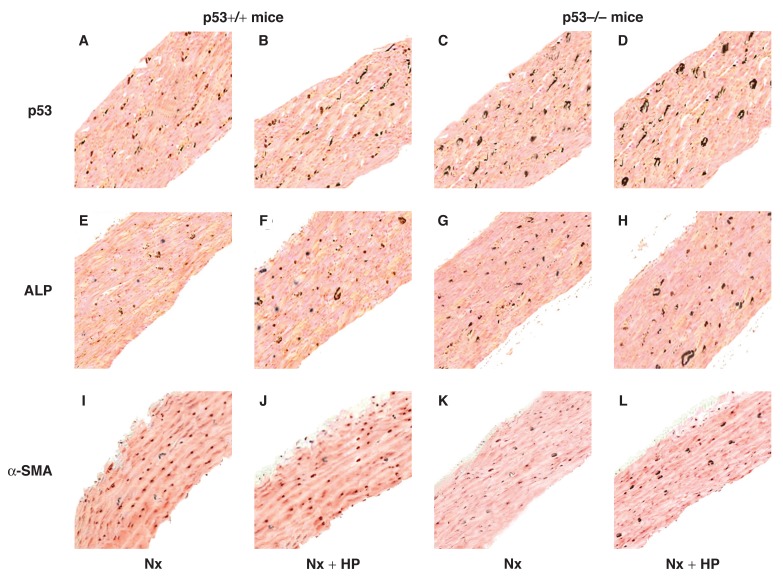
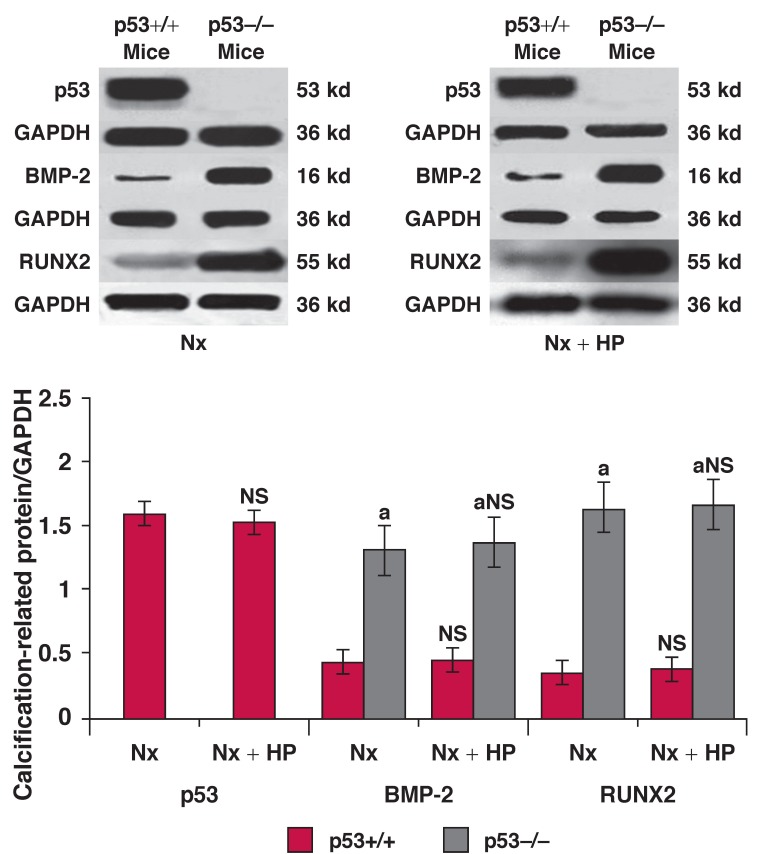
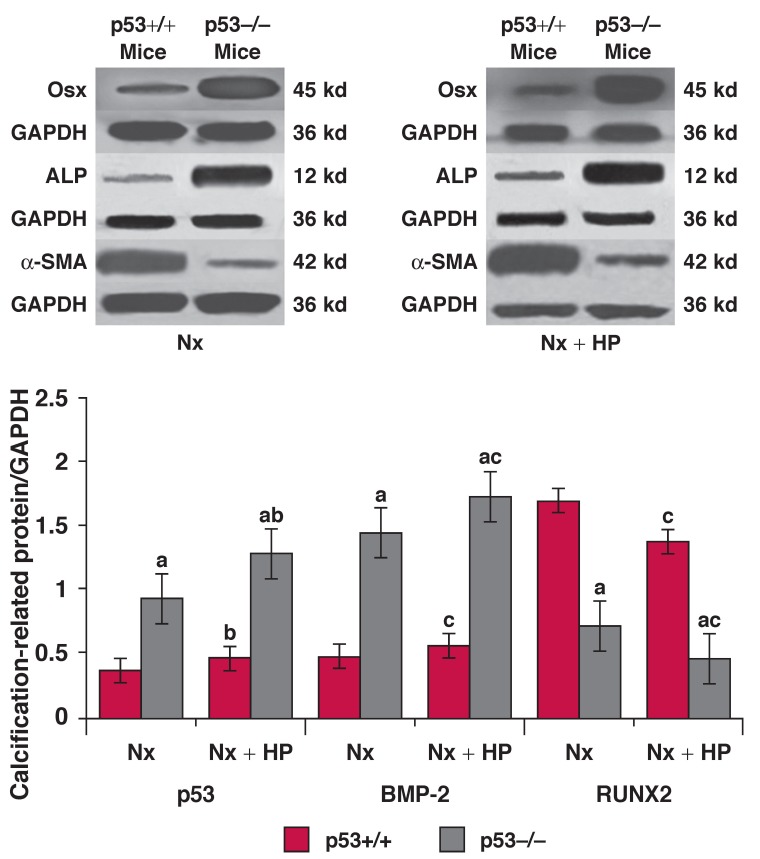
Methods: Experimental models of CKD-associated vascular calcification generated by five-sixth (5/6) nephrectomy (Nx) and a high-phosphate (HP) diet were used in p53+/+ and p53-/- mice. Following 5/6 Nx, aortic calcification, markers of osteogenic differentiation, VSMCs and p53 protein in aortic tissues were studied.
Results: Aortic calcification was observed after eight weeks following 5/6 Nx in mice of both genotypes, and expression of the markers of osteogenic differentiation in the VSMCs was increased. These changes were continuously observed up to 12 weeks after 57/6 Nx, and particularly after 5/6 Nx + HP. Compared with p53+/+ mice, aortic calcification in p53-/- mice was more severe (p < 0.001). Expression of the markers of osteogenic differentiation was noticeably increased (p < 0.001), while expression of the marker of VSMCs had decreased (p < 0.001). Statistical analysis demonstrated that the markers of osteogenic differentiation were negatively correlated with p53, and the marker of VSMCs was positively correlated with p53 (p < 0.001).
Conclusion: p53 has the potential to negatively regulate the osteogenic differentiation of VSMCs in CKD mice.
Figures
Similar articles
-
Paraspeckle protein NONO attenuates vascular calcification by inhibiting bone morphogenetic protein 2 transcription.Kidney Int. 2024 Jun;105(6):1221-1238. doi: 10.1016/j.kint.2024.01.039. Epub 2024 Feb 27. Kidney Int. 2024. PMID: 38417578
-
Msx2 is required for vascular smooth muscle cells osteoblastic differentiation but not calcification in insulin-resistant ob/ob mice.Atherosclerosis. 2017 Oct;265:14-21. doi: 10.1016/j.atherosclerosis.2017.07.028. Epub 2017 Jul 29. Atherosclerosis. 2017. PMID: 28829997
-
O-GlcNAc transferase promotes vascular smooth muscle calcification through modulating Wnt/β-catenin signaling.FASEB J. 2024 Dec 13;38(24):e70271. doi: 10.1096/fj.202401649RR. FASEB J. 2024. PMID: 39704274
-
Signaling pathways involved in vascular smooth muscle cell calcification during hyperphosphatemia.Cell Mol Life Sci. 2019 Jun;76(11):2077-2091. doi: 10.1007/s00018-019-03054-z. Epub 2019 Mar 18. Cell Mol Life Sci. 2019. PMID: 30887097 Free PMC article. Review.
-
Key regulators of vascular calcification in chronic kidney disease: Hyperphosphatemia, BMP2, and RUNX2.PeerJ. 2024 Sep 19;12:e18063. doi: 10.7717/peerj.18063. eCollection 2024. PeerJ. 2024. PMID: 39308809 Free PMC article. Review.
Cited by
-
Refining the Mouse Subtotal Nephrectomy in Male 129S2/SV Mice for Consistent Modeling of Progressive Kidney Disease With Renal Inflammation and Cardiac Dysfunction.Front Physiol. 2019 Nov 15;10:1365. doi: 10.3389/fphys.2019.01365. eCollection 2019. Front Physiol. 2019. PMID: 31803059 Free PMC article.
-
Low-level overexpression of p53 promotes warfarin-induced calcification of porcine aortic valve interstitial cells by activating Slug gene transcription.J Biol Chem. 2018 Mar 9;293(10):3780-3792. doi: 10.1074/jbc.M117.791145. Epub 2018 Jan 22. J Biol Chem. 2018. PMID: 29358327 Free PMC article.
-
Histone Lysine Methylation Modification and Its Role in Vascular Calcification.Front Endocrinol (Lausanne). 2022 Jun 16;13:863708. doi: 10.3389/fendo.2022.863708. eCollection 2022. Front Endocrinol (Lausanne). 2022. PMID: 35784574 Free PMC article. Review.
-
miR‑204 inhibits the osteogenic differentiation of mesenchymal stem cells by targeting bone morphogenetic protein 2.Mol Med Rep. 2020 Jan;21(1):43-50. doi: 10.3892/mmr.2019.10791. Epub 2019 Nov 5. Mol Med Rep. 2020. PMID: 31746352 Free PMC article.
-
Axl tyrosine kinase protects against tubulo-interstitial apoptosis and progression of renal failure in a murine model of chronic kidney disease and hyperphosphataemia.PLoS One. 2014 Jul 14;9(7):e102096. doi: 10.1371/journal.pone.0102096. eCollection 2014. PLoS One. 2014. PMID: 25019319 Free PMC article.
References
-
- Schiffrin EL, Lipman ML, Mann JF. Chronic kidney disease: Effects on the cardiovascular system. Circulation. 2007;116:85–97. - PubMed
-
- Tonelli M, Wiebe N, Culleton B, House A, Rabbat C, Fok M. et al. Chronic kidney disease and mortality risk: a systematic review. J Am Soc Nephrol. 2006;17:2034–2047. - PubMed
-
- Westenfeld R, Schäfer C, Smeets R, Brandenburg VM, Floege J, Ketteler M, Jahnen-Dechent W. Fetuin-A (AHSG) prevents extraosseous calcification induced by uraemia and phosphate challenge in mice. Nephrol Dial Transplant. 2007;22:1537–1546. - PubMed
-
- Collins AJ, Li S, Ma JZ, Herzog C. Cardiovascular disease in endstage renal disease patients. Am J Kidney Dis. 2001;38:S26–S29. - PubMed
-
- Chen NX, Moe SM. Vascular calcification in chronic kidney disease. Semin Nephrol. 2004;24:61–68. - PubMed
Publication types
MeSH terms
Substances
LinkOut - more resources
Full Text Sources
Medical
Research Materials
Miscellaneous
