. 2011 Dec 20;108(51):20497-502.
doi: 10.1073/pnas.1113536108. Epub 2011 Dec 5.

The genomic binding sites of a noncoding RNA

Affiliations

The genomic binding sites of a noncoding RNA

Matthew D Simon et al. Proc Natl Acad Sci U S A. .

Abstract

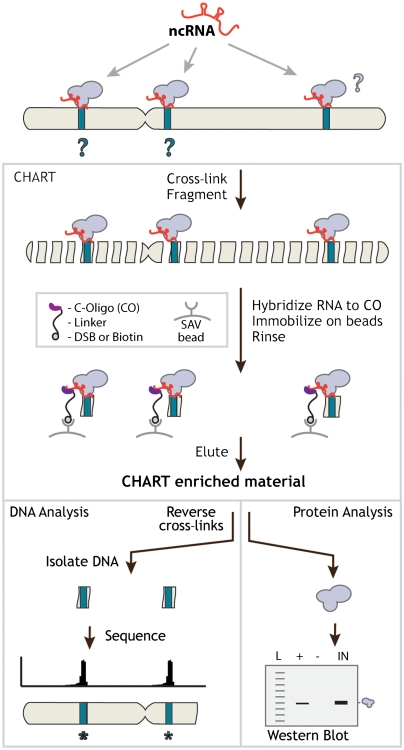
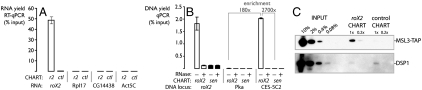
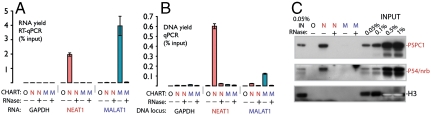
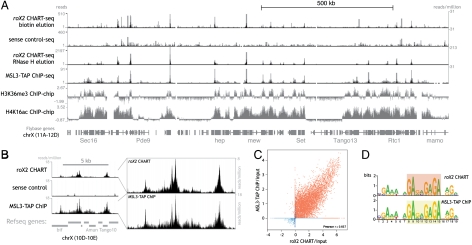
Long noncoding RNAs (lncRNAs) have important regulatory roles and can function at the level of chromatin. To determine where lncRNAs bind to chromatin, we developed capture hybridization analysis of RNA targets (CHART), a hybridization-based technique that specifically enriches endogenous RNAs along with their targets from reversibly cross-linked chromatin extracts. CHART was used to enrich the DNA and protein targets of endogenous lncRNAs from flies and humans. This analysis was extended to genome-wide mapping of roX2, a well-studied ncRNA involved in dosage compensation in Drosophila. CHART revealed that roX2 binds at specific genomic sites that coincide with the binding sites of proteins from the male-specific lethal complex that affects dosage compensation. These results reveal the genomic targets of roX2 and demonstrate how CHART can be used to study RNAs in a manner analogous to chromatin immunoprecipitation for proteins.


Conflict of interest statement

The authors declare no conflict of interest.

Figures

Fig. 1.
Fig. 1.
CHART is a hybridization-based strategy that uses complementary oligonucleotides to purify the RNA together with its targets from reversibly cross-linked extracts. The cartoon here shows the scenario where the RNA is bound in direct contact with the DNA together with proteins, but other configurations are also possible (see the text). CHART-enriched material can be analyzed in various ways; the two examples depicted here are (Left) sequencing the DNA to determine genomic loci where the RNA is bound and (Right) analyzing the protein content by Western blot analysis.
Fig. 2.
Fig. 2.
CHART allows specific enrichment of roX2 along with its associated targets. (A) Enrichment of RNAs by roX2 CHART (using C-oligos listed in Table S2) as measured by RT-qPCR. (B) Enrichment of DNA loci by roX2 CHART. CES-5C2 is a regulatory site enriched by roX2 CHART. The enrichment values are labeled for comparison of CES-5C2 by roX2 CHART with sense-oligo CHART and also with roX2 CHART at a control site, Pka. RNase-positive lanes represent CHART enrichment from extracts pretreated with RNase to eliminate RNA-mediated signal. Error bars represent ±SEM for three qPCR experiments. Primers are listed in Table S3. (C) Specific enrichment of a tagged MSL subunit, MSL3-TAP, by roX2 CHART. DSP1 antisera (64) is used as a negative control because of its sensitivity.
Fig. 3.
Fig. 3.
NEAT1 CHART, but not MALAT1 CHART, specifically enriches NEAT1 RNA along with its protein and DNA targets. (A) Enrichment of the indicated RNAs from HeLa chromatin extracts by either N, NEAT1 CHART; M, MALAT1 CHART; or O, a mock (no C-oligo) control as measured by RT-qPCR. (B) Similar to A, but enrichment of associated DNA loci as determined by qPCR. Error bars represent ±SEM for three independent CHART experiments. (C) Specific enrichment of two paraspeckle proteins, p54/nrb and PSPC1, by NEAT1 CHART from MCF7 extract. Histone H3 was chosen as a negative control because it is a highly sensitive antiserum and NEAT1 is not expected to be predominantly chromatin bound.
Fig. 4.
Fig. 4.
roX2 CHART-seq reveals robust enrichment of roX2 on chrX and precise localization to sites of MSL binding. (A) Top four rows, mapped sequencing reads from roX2 and sense-oligo CHART data (performed from S2 cells expressing MSL3-TAP) (55) compared to MSL3-TAP ChIP data from MSL3-TAP Clone 8 (41). Both mapped read numbers and normalized read numbers are listed. Note the RNase-H–eluted roX2 CHART has higher peaks signals at roX2 binding sites and required a different scale than the other three sequencing tracks. Below, ChIP-chip data for the indicated histone modifications are shown (S2 cells, ModENCODE) (65). (B) Finer-scale examples and comparisons of roX2 CHART data, with normalized read depth, except Far Right where normalized for peak height. (C) Correlation between the roX2 CHART signal and MSL3-TAP ChIP signal (41) by plotting the conservative enrichment magnitudes (relative to corresponding inputs) on a log 2 scale of roX2 CHART peaks (from combined RNase-H-elution replicates) and MSL3-TAP ChIP peaks. Peaks from chrX are shown in red and autosomal peaks in blue, but the Pearson r was determined including both sets of peaks. (D) A motif identified from the top roX2 CHART peaks, depicted here as a motif logo in comparison with a nearly identical motif previously determined from MSL3-TAP ChIP-chip data (41).

Similar articles

Cited by

References

    1. Jacob F, Monod J. Genetic regulatory mechanisms in the synthesis of proteins. J Mol Biol. 1961;3:318–356. - PubMed
    1. Guttman M, et al. Chromatin signature reveals over a thousand highly conserved large non-coding RNAs in mammals. Nature. 2009;458:223–227. - PMC - PubMed
    1. Birney E, et al. Identification and analysis of functional elements in 1% of the human genome by the ENCODE pilot project. Nature. 2007;447:799–816. - PMC - PubMed
    1. Mercer TR, Dinger ME, Sunkin SM, Mehler MF, Mattick JS. Specific expression of long noncoding RNAs in the mouse brain. Proc Natl Acad Sci USA. 2008;105:716–721. - PMC - PubMed
    1. Ponting CP, Oliver PL, Reik W. Evolution and functions of long noncoding RNAs. Cell. 2009;136:629–641. - PubMed

Publication types

Associated data