. 2011 Dec 20;108(51):20666-71.
doi: 10.1073/pnas.1114573108. Epub 2011 Dec 5.

Heterozygote advantage as a natural consequence of adaptation in diploids

Affiliations

Heterozygote advantage as a natural consequence of adaptation in diploids

Diamantis Sellis et al. Proc Natl Acad Sci U S A. .

Abstract

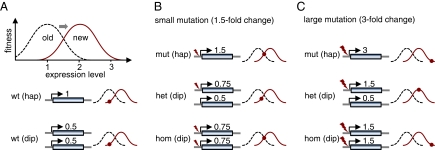
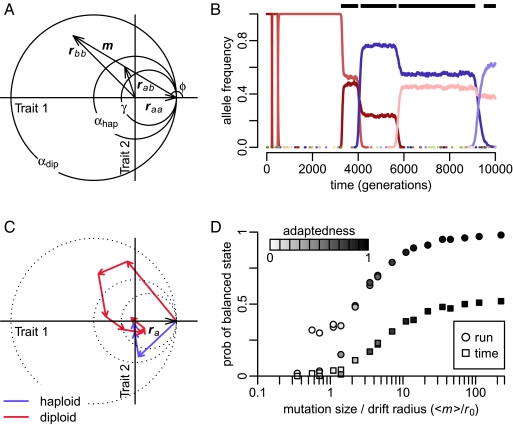
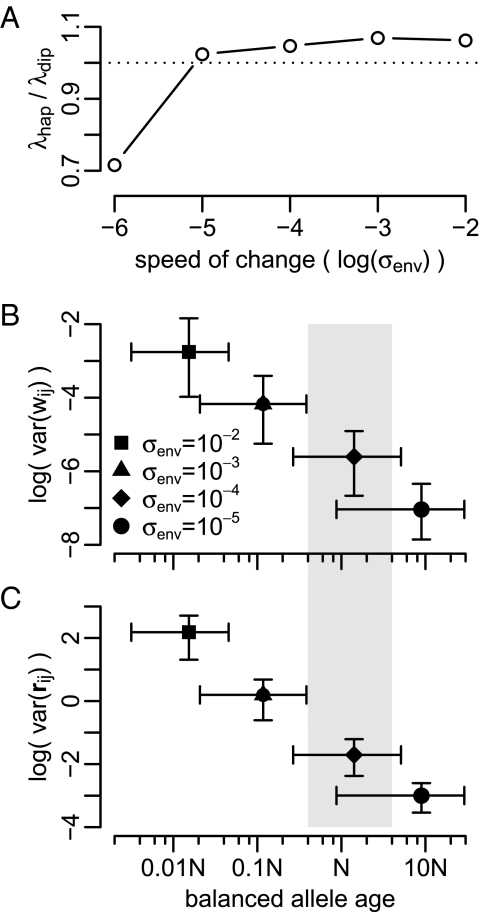
Molecular adaptation is typically assumed to proceed by sequential fixation of beneficial mutations. In diploids, this picture presupposes that for most adaptive mutations, the homozygotes have a higher fitness than the heterozygotes. Here, we show that contrary to this expectation, a substantial proportion of adaptive mutations should display heterozygote advantage. This feature of adaptation in diploids emerges naturally from the primary importance of the fitness of heterozygotes for the invasion of new adaptive mutations. We formalize this result in the framework of Fisher's influential geometric model of adaptation. We find that in diploids, adaptation should often proceed through a succession of short-lived balanced states that maintain substantially higher levels of phenotypic and fitness variation in the population compared with classic adaptive walks. In fast-changing environments, this variation produces a diversity advantage that allows diploids to remain better adapted compared with haploids despite the disadvantage associated with the presence of unfit homozygotes. The short-lived balanced states arising during adaptive walks should be mostly invisible to current scans for long-term balancing selection. Instead, they should leave signatures of incomplete selective sweeps, which do appear to be common in many species. Our results also raise the possibility that balancing selection, as a natural consequence of frequent adaptation, might play a more prominent role among the forces maintaining genetic variation than is commonly recognized.


Conflict of interest statement

The authors declare no conflict of interest.

Figures

Fig. 1.
Fig. 1.
Adaptation to a change in the optimal level of gene expression. (A) In both haploids (hap) and diploids (dip), the wild type (wt) is perfectly adapted to the original fitness function (dashed black curve). After an external change, the optimal expression level becomes twice the original level (solid red curve). Note that we are assuming phenotypic codominance; thus, the two individual gene copies in a diploid each contribute expression level 0.5, such that overall expression is 1. (B) Fitness effects of a small mutation that increases expression level by 1.5-fold. The mutant heterozygote (het) is less fit than both the haploid mutant (mut) and the mutant homozygote (hom). (C) Effects of a large mutation that increases expression by threefold. In this case, the mutant heterozygote effectively has only twofold increased expression, and thus lands right at the new fitness optimum. In contrast, both the haploid mutant and the mutant homozygote “overshoot” the optimum.
Fig. 2.
Fig. 2.
Fisher's geometric model of adaptation in two dimensions. (A) Two orthogonal axes represent independent character traits. Fitness is determined by a symmetrical Gaussian function centered at the origin. Consider a population initially monomorphic for the wild-type allele raa = (2,0). A mutation m gives rise to a mutant phenotype vector rbb = raa + m. The phenotype of the mutant heterozygote assuming phenotypic codominance (h = 1/2) is rab = raa + m/2. The different circles specify the areas in which mutations are adaptive in haploids (αhap), adaptive in diploids (αdip), and replacing in diploids (γ). (B) Frequency trajectories of all alleles present during a representative adaptive walk in a diploid population with N = 5⋅104, raa = (2,0), and <m> = σw = 1. Different colors represent different alleles. The black bars over the graph indicate the periods during which a balanced polymorphism was present. (C) Representative adaptive walks in a haploid population and a diploid population. Vectors depict the successive mutations that led to the prevalent allele at the end of the walk. The haploid walk consists of a single lineage of successive mutations, each conferring a selective advantage over the previous one. In the diploid walk, the first mutation overshoots the fitness optimum, generating a sequence of intermediate balanced states. Note that the areas αhap, αdip, and γ (dotted circles) from A apply only to the first mutation in the walk when the population is still monomorphic for ra. (D) Probability of observing balanced polymorphism during adaptive walks toward a fixed fitness optimum as a function of mutation sizes scaled by effective drift radius r0 (SI Text) for the various settings of N, σw, and <m> specified in Table S1. Circles show the probability of at least one balanced state arising over the course of a walk, and squares show the fraction of time during which balanced states were present. Coloration indicates the average “adaptedness” achieved during a walk, defined by the improvement in mean population fitness over the walk (<wend> − <wstart>) relative to the maximally possible improvement (1 − <wstart>).
Fig. 3.
Fig. 3.
Statistics of adaptive walks under a moving fitness optimum. (A) Ratio of the average lag in fitness (λ) between the population and the optimum in haploids (hap) and diploids (dip) as a function of the speed of environmental change. In fast-changing environments, diploid populations follow the moving optimum more closely than haploids (λhap/λdip > 1). (B) Fitness variance attributable to balanced polymorphisms (frequency 0.05 < x < 0.95) and the age of the balanced polymorphism for different values of σenv. Both quantities are estimated from the balanced polymorphisms that were present at the end of simulation runs. The age of a balanced polymorphism is defined as the time since the most recent common ancestor of its constituent alleles. Data points are medians over 103 runs, and error bars specify the 10% and 90% quantiles. The gray-shaded area (0.04N < age < 4N) indicates the expected age range of common neutral polymorphisms at frequencies between 0.05 < x < 0.95. (C) Same as in B but phenotypic variance is shown instead of fitness variance.

Similar articles

Cited by

References

    1. Haldane JBS. A mathematical theory of natural and artificial selection, part V: Selection and mutation. Math Proc Camb Philos Soc. 1927;23:838–844.
    1. Carroll SB. Evo-devo and an expanding evolutionary synthesis: A genetic theory of morphological evolution. Cell. 2008;134(1):25–36. - PubMed
    1. Lemos B, Meiklejohn CD, Caceres M, Hartl DL. Rates of divergence in gene expression profiles of primates, mice, and flies: Stabilizing selection and variability among functional categories. Evolution. 2005;59:126–137. - PubMed
    1. Denver DR, et al. The transcriptional consequences of mutation and natural selection in Caenorhabditis elegans. Nat Genet. 2005;37:544–548. - PubMed
    1. Rifkin SA, Houle D, Kim J, White KP. A mutation accumulation assay reveals a broad capacity for rapid evolution of gene expression. Nature. 2005;438:220–223. - PubMed

Publication types