

Climate-associated phenological advances in bee pollinators and bee-pollinated plants
- PMID: 22143794
- PMCID: PMC3251156
- DOI: 10.1073/pnas.1115559108
Climate-associated phenological advances in bee pollinators and bee-pollinated plants
Abstract
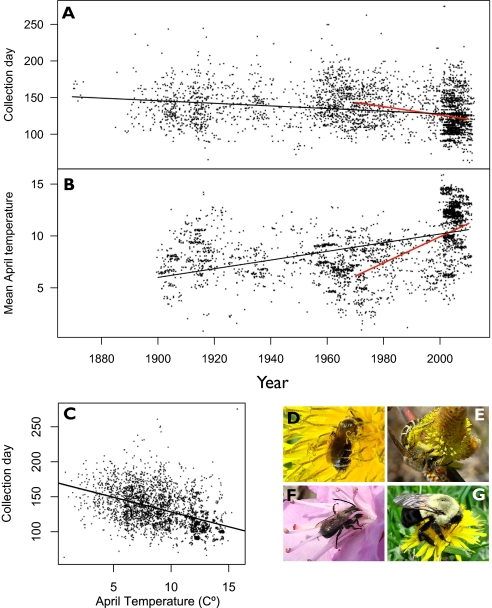
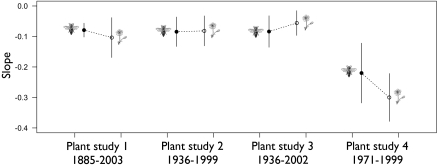
The phenology of many ecological processes is modulated by temperature, making them potentially sensitive to climate change. Mutualistic interactions may be especially vulnerable because of the potential for phenological mismatching if the species involved do not respond similarly to changes in temperature. Here we present an analysis of climate-associated shifts in the phenology of wild bees, the most important pollinators worldwide, and compare these shifts to published studies of bee-pollinated plants over the same time period. We report that over the past 130 y, the phenology of 10 bee species from northeastern North America has advanced by a mean of 10.4 ± 1.3 d. Most of this advance has taken place since 1970, paralleling global temperature increases. When the best available data are used to estimate analogous rates of advance for plants, these rates are not distinguishable from those of bees, suggesting that bee emergence is keeping pace with shifts in host-plant flowering, at least among the generalist species that we investigated.
Conflict of interest statement
The authors declare no conflict of interest.
Figures
References
-
- Parmesan C, Yohe G. A globally coherent fingerprint of climate change impacts across natural systems. Nature. 2003;421(6918):37–42. - PubMed
-
- Parmesan C. Ecological and evolutionary responses to recent climate change. Annu Rev Ecol Syst. 2006;37:637–669.
-
- Root TL, et al. Fingerprints of global warming on wild animals and plants. Nature. 2003;421(6918):57–60. - PubMed
-
- Harrington R, Woiwod I, Sparks T. Climate change and trophic interactions. Trends Ecol Evol. 1999;14(4):146–150. - PubMed
Publication types
MeSH terms
LinkOut - more resources
Full Text Sources
Miscellaneous
