. 2011 Dec 20;108(51):20748-53.
doi: 10.1073/pnas.1113801108. Epub 2011 Dec 5.

Discordant antigenic drift of neuraminidase and hemagglutinin in H1N1 and H3N2 influenza viruses

Affiliations

Discordant antigenic drift of neuraminidase and hemagglutinin in H1N1 and H3N2 influenza viruses

Matthew R Sandbulte et al. Proc Natl Acad Sci U S A. .

Abstract

Seasonal epidemics caused by influenza virus are driven by antigenic changes (drift) in viral surface glycoproteins that allow evasion from preexisting humoral immunity. Antigenic drift is a feature of not only the hemagglutinin (HA), but also of neuraminidase (NA). We have evaluated the antigenic evolution of each protein in H1N1 and H3N2 viruses used in vaccine formulations during the last 15 y by analysis of HA and NA inhibition titers and antigenic cartography. As previously shown for HA, genetic changes in NA did not always lead to an antigenic change. The noncontinuous pattern of NA drift did not correspond closely with HA drift in either subtype. Although NA drift was demonstrated using ferret sera, we show that these changes also impact recognition by NA-inhibiting antibodies in human sera. Remarkably, a single point mutation in the NA of A/Brisbane/59/2007 was primarily responsible for the lack of inhibition by polyclonal antibodies specific for earlier strains. These data underscore the importance of NA inhibition testing to define antigenic drift when there are sequence changes in NA.


Conflict of interest statement

The authors declare no conflict of interest.

Figures

Fig. 1.
Fig. 1.
Comparison of the antigenic and genetic evolution of NA and HA of influenza A (H1N1) virus. (A and B) Phylogenetic trees of the coding region of NA (A) and HA1 (B) nucleotide sequences. A/Brevig Mission/1918 was chosen as outgroup for both trees. Scale bars roughly represent 10% of nucleotide substitutions between close relatives. (C) NA and (D) HA genetic maps. The vertical and horizontal axes represent genetic distance, in this case the number of amino acid substitutions between strains; the spacing between grid lines is 3 amino acid substitutions. (E) NA and (F) HA antigenic maps based on NI and HI data, in which the viruses are shown as circles and antisera as squares. The spacing between grid lines is one unit of antigenic distance, corresponding to a twofold dilution of antisera in the NI and HI assays. The orientations of all maps were chosen to roughly match the orientation of the HI antigenic map in F, and the color-coding of viruses is consistent among all panels.
Fig. 2.
Fig. 2.
Comparison of the antigenic and genetic evolution of NA and HA of influenza A (H3N2) virus. (A and B) Phylogenetic trees of the coding region of NA (A) and HA1 (B) nucleotide sequences. A/Japan/305/1957 was chosen as outgroup for the NA tree and A/Duck/Hokkaido/33/80 for the HA1 tree. Scale bars represent approximately 10% of nucleotide substitutions between close relatives. (C and D) Genetic maps of the amino acid sequences of NA (C) and HA1 (D). The vertical and horizontal axes represent genetic distance, in this case the number of amino acid substitutions between strains; the spacing between grid lines is 4 amino acid substitutions. (E) NA and (F) HA antigenic maps of influenza A (H3N2) virus based on NI and HI data, in which the viruses are shown as circles and antisera as squares. The spacing between grid lines is one unit of antigenic distance, corresponding to a twofold dilution of antisera in the NI and HI assays. The orientations of all maps were chosen to roughly match the orientation of the H3 antigenic map in F, and the color-coding of viruses is consistent among all panels.
Fig. 3.
Fig. 3.
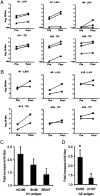
Human pre- and postvaccination NI titers to homologous NA antigens and NAs of influenza virus strains in subsequent vaccine formulations. Volunteers received LAIV or TIV vaccines, as noted in graphs. Both vaccine types contained 2006/07 seasonal vaccine strains, including NC/99 (H1N1) and WI/05 (H3N2). Serum specimens were collected at day 0 (pre) and day 28 postvaccination. Pre and postvaccination NI titers of three volunteers in each vaccine group determined (A) against H1N1-derived NC/99 NA (●), SI/06 NA (■), and BR/07 NA (▲) and (B) against H3N2-derived WI/05 NA (●) and UY/07 NA (▲). The mean fold-increase in NI titer after vaccination against (C) the three N1 antigens, and (D) the two NA antigens. Statistical significance, *P < 0.05.
Fig. 4.
Fig. 4.
One amino acid in BR/07 accounts for most of the NA drift variation from preceding H1N1 strains. (A) Alignment of amino acid differences in the NA globular head between the consensus of three antigenically similar NA proteins (TX/91, NC/99, and SI/06) and the antigenically divergent BR/07 NA. (B–D) Reactivity of H6 reassortant viruses with NA of BR/07 containing point mutations with ferret antisera raised against (B) NC/99, (C) SI/06, and (D) BR/07. Each data point represents the mean result of two independent assays, and error bars represent SD. (E and F) NI titers of human sera against viruses containing NA of NC/99, SI/06, BR/07, and BR/07 mutants.
Fig. 5.
Fig. 5.
Sites of amino acid differences between the NA globular head of SI/06 and BR/07 are shown on wire and filled space models of the monomeric (A) and tetrameric (B) NA, constructed using Modeler (32) on subtype N1 (pdb code 2HTY). Sialic acid, docked into the enzyme active site (gray), is represented as sticks with colored carbon (cyan), oxygen (red), and nitrogen (blue) atoms. Amino acids of SI/06 are highlighted: Glu214 (yellow), Arg222 (red), Gly249 (orange), Thr287 (cyan), Lys329 (magenta), Asp344 (blue), and Gly354 (pale orange).

References

    1. Webster RG, Laver WG, Air GM, Schild GC. Molecular mechanisms of variation in influenza viruses. Nature. 1982;296:115–121. - PubMed
    1. Laver WG, Air GM, Webster RG, Markoff LJ. Amino acid sequence changes in antigenic variants of type A influenza virus N2 neuraminidase. Virology. 1982;122:450–460. - PubMed
    1. Luther P, Bergmann KC, Oxford JS. An investigation of antigenic drift of neuraminidases of influenza A (H1N1) viruses. J Hyg (Lond) 1984;92:223–229. - PMC - PubMed
    1. Kilbourne ED, Johansson BE, Grajower B. Independent and disparate evolution in nature of influenza A virus hemagglutinin and neuraminidase glycoproteins. Proc Natl Acad Sci USA. 1990;87:786–790. - PMC - PubMed
    1. Schulman JL, Khakpour M, Kilbourne ED. Protective effects of specific immunity to viral neuraminidase on influenza virus infection of mice. J Virol. 1968;2:778–786. - PMC - PubMed

Publication types