. 2011 Dec 20;108(51):20808-13.
doi: 10.1073/pnas.1111448109. Epub 2011 Dec 5.

Myopathy caused by mammalian target of rapamycin complex 1 (mTORC1) inactivation is not reversed by restoring mitochondrial function

Affiliations

Myopathy caused by mammalian target of rapamycin complex 1 (mTORC1) inactivation is not reversed by restoring mitochondrial function

Klaas Romanino et al. Proc Natl Acad Sci U S A. .

Abstract

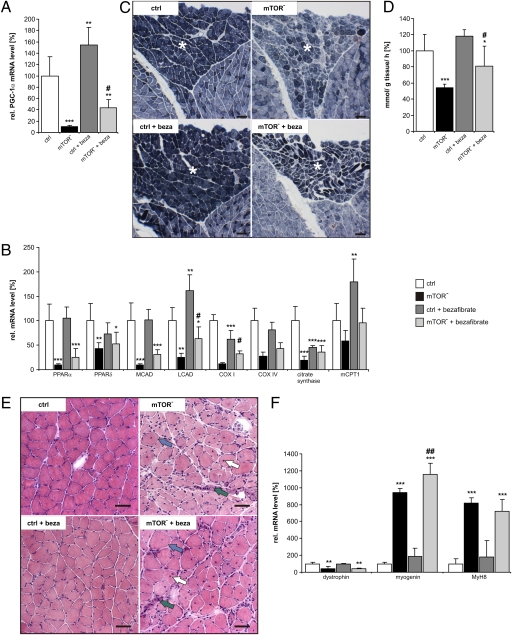
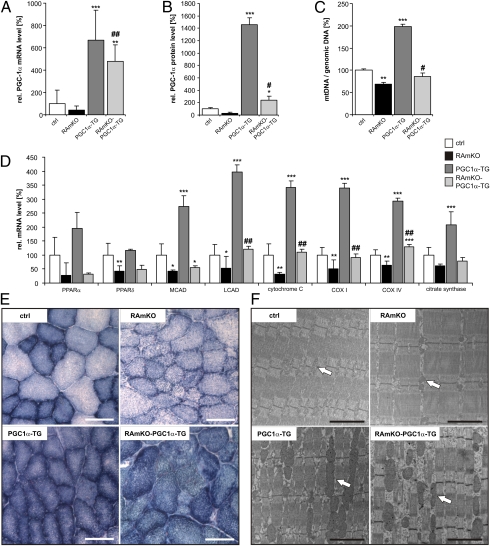
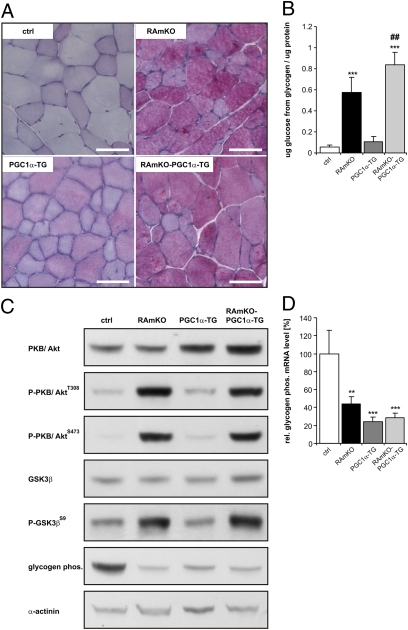
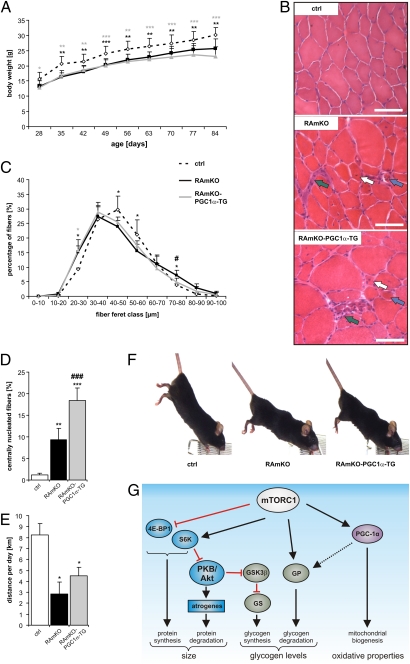
Mammalian target of rapamycin complex 1 (mTORC1) is central to the control of cell, organ, and body size. Skeletal muscle-specific inactivation of mTORC1 in mice results in smaller muscle fibers, fewer mitochondria, increased glycogen stores, and a progressive myopathy that causes premature death. In mTORC1-deficient muscles, peroxisome proliferator-activated receptor gamma coactivator 1-α (PGC-1α), which regulates mitochondrial biogenesis and glucose homeostasis, is strongly down-regulated. Here we tested whether induction of mitochondrial biogenesis pharmacologically or by the overexpression of PGC-1α is sufficient to reverse the phenotype of mice deficient for mTORC1. We show that both approaches normalize mitochondrial function, such as oxidative capacity and expression of mitochondrial genes. However, they do not prevent or delay the progressive myopathy. In addition, we find that mTORC1 has a much stronger effect than PGC-1α on the glycogen content in muscle. This effect is based on the strong activation of PKB/Akt in mTORC1-deficient mice. We also show that activation of PKB/Akt not only affects glycogen synthesis but also diminishes glycogen degradation. Thus, our work provides strong functional evidence that mitochondrial dysfunction in mice with inactivated mTORC1 signaling is caused by the down-regulation of PGC-1α. However, our data also show that the impairment of mitochondria does not lead directly to the lethal myopathy.


Conflict of interest statement

The authors declare no conflict of interest.

Figures

Fig. 1.
Fig. 1.
Bezafibrate partially restores mitochondrial function in muscles in the absence of mTOR but does not prevent the myopathy. (A) Relative mRNA levels of PGC-1α were determined by qRT-PCR in control (ctrl), mTOR-deficient (mTOR), and bezafibrate-treated control (ctrl + beza) and mTOR (mTOR + beza) soleus muscle. Data represent mean ± SEM (n ≥ 3 mice). (B) Relative mRNA levels of PPARα and PPAR δ, MCAD, LCAD, COX I and COX IV, citrate synthase and mCPT1 in the soleus muscle of indicated mice. Note that bezafibrate increases expression of most genes. Data represent mean ± SEM (n ≥ 3 mice). (C) Oxidative properties of hind leg muscle increase upon bezafibrate treatment. Pictures show representative cross-sections stained for SDH activity (dark blue). The soleus muscle is marked by an asterisk. (Scale bar, 100 μm.) (D) Quantification of SDH activity as detected by an enzymatic assay (for details see SI Materials and Methods). Data represent mean ± SD (n ≥ 5 mice). (E) H&E staining of cross-sections of soleus muscle. In the muscle of mTOR and mTOR + beza mice, some large (blue arrows) but also small fibers are present. Both groups of mice also show centralized nuclei (white arrows) and many mononuclear cells (green arrows). (Scale bar, 50 μm.) (F) Relative mRNA levels of the indicated proteins in soleus muscle as determined by qRT-PCR. Data represent mean ± SEM (n ≥ 3 mice). In all experiments shown, mice were 20-wk-old males. Significant differences between control and experimental groups are indicated by *; significant changes between mTOR and mTOR + beza mice are indicated by #. */#P < 0.05; **/##P < 0.01; ***/###P < 0.001.
Fig. 2.
Fig. 2.
Transgenic expression of PGC-1α in RAmKO mice normalizes mitochondrial properties. (A) Relative mRNA levels of PGC-1α in EDL muscle of 90-d-old mice of different genotypes as determined by qRT-PCR (n ≥ 3 mice). (B) Quantification of PGC-1α protein levels. Western blot analysis was performed from lysates of EDL muscle from 80-d-old mice. Values represent average of gray values (n ≥ 3 mice; see also Fig. S2B). (C) Ratio between mtDNA and genomic DNA in EDL muscle of 140-d-old mice as determined by qRT-PCR (n ≥ 2 mice). (D) Relative mRNA levels of the indicated genes in EDL muscle of 90-d-old mice as determined by qRT-PCR (n ≥ 3 mice). Abbreviations are as described in the legend of Fig. 1. (E) Activity of oxidative enzymes examined by NADH-TR staining (blue precipitate) in TA muscle of 130-d-old mice. (Scale bar, 100 μm.) (F) Electron micrographs of longitudinal sections of EDL muscle of 140-d-old mice. (Scale bar, 200 nm.) Mitochondria are indicated by white arrows. Values in AD represent mean ± SD. Significant differences between control and genetically modified mice are indicated by *; significant changes between RAmKO and RAmKO-PGC1α-TG mice are indicated by #. */#P < 0.05; **/##P < 0.01; ***/###P < 0.001.
Fig. 3.
Fig. 3.
Glycogen content is increased in all genetically modified mouse models. (A) PAS staining of cross-sections of TA muscle of 90-d-old mice. The reaction product (magenta color) is indicative of the amount of glycogen in the tissue. (Scale bar, 50 μm.) (B) Quantification of the glycogen concentration in TA muscle from 90-d-old mice as determined by an enzymatic assay (for details see SI Materials and Methods). (C) Western blot analysis of EDL muscle from 80-d-old mice using antibodies directed against the proteins indicated. An equal amount of protein was loaded in each lane. An antibody against α-actinin was used as loading control. For quantification see Table S2. (D) Relative mRNA levels of glycogen phosphorylase in EDL muscle of 90-d-old mice as determined by qRT-PCR (n ≥ 3 mice). Values in B and D represent mean ± SD. Significant differences between control and genetically modified mice are indicated by *; significant changes between RAmKO and RAmKO-PGC1α-TG mice are indicated by #. */#P < 0.05; **/##P < 0.01; ***/###P < 0.001.
Fig. 4.
Fig. 4.
Increased PGC-1α levels do not prevent progressive myopathy in RAmKO mice. (A) Mice of each genotype were weighed every week (n ≥ 5 mice). (B) H&E staining of cross-sections of TA muscle of 130-d-old mice. In the muscle of RAmKO and RAmKO-PGC1α-TG mice some large (blue arrows) but also small fibers are present. Both genotypes also show centralized nuclei (white arrows) and many mononuclear cells (green arrows). (C) Distribution of fiber size in the TA muscle of 14-d-old mice (n = 2 for control; n = 4 for RAmKO; n = 5 for RAmKO-PGC-1α-TG mice). (D) Percentage of muscle fibers with centralized nuclei in TA muscle of 90-d-old mice (n ≥ 5 mice). All fibers (∼2,000) of one midbelly cross-section were analyzed in experiments shown in C and D. (E) Average distance run voluntarily per day between the ages of 95 d and 105 d (n ≥ 3 mice). (F) Photographs of 140-d-old littermates. The RAmKO and RAmKO-PGC1α-TG mice are leaner and suffer from a kyphosis. (G) Proposed model for the contribution of different signaling pathways to the disease phenotype in mTORC1-deficient skeletal muscle. The balance between protein synthesis [via eIF4E-Binding Protein 1 (4E-BP1) and S6 kinase (S6K)] and protein degradation contributes to muscle size (Left). The balance between glycogen synthesis [via PKB/Akt; GSK3β, and glycogen synthase (GS)] and glycogen degradation [via glycogen phosphorylase (GP)] regulates glycogen levels (Center). PGC-1α has only a minor contribution to the glycogen levels but is the main regulator of the oxidative properties (Right). Values in A, C, D, and E represent mean ± SD. Significant differences between control and genetically modified mice are indicated by *; significant changes between RAmKO and RAmKO-PGC1α-TG mice are indicated by #. */#P < 0.05; **/##P < 0.01; ***/###P < 0.001.

Similar articles

Cited by

References

    1. Glass DJ. Skeletal muscle hypertrophy and atrophy signaling pathways. Int J Biochem Cell Biol. 2005;37:1974–1984. - PubMed
    1. Wullschleger S, Loewith R, Hall MN. TOR signaling in growth and metabolism. Cell. 2006;124:471–484. - PubMed
    1. Risson V, et al. Muscle inactivation of mTOR causes metabolic and dystrophin defects leading to severe myopathy. J Cell Biol. 2009;187:859–874. - PMC - PubMed
    1. Bentzinger CF, et al. Skeletal muscle-specific ablation of raptor, but not of rictor, causes metabolic changes and results in muscle dystrophy. Cell Metab. 2008;8:411–424. - PubMed
    1. Um SH, et al. Absence of S6K1 protects against age- and diet-induced obesity while enhancing insulin sensitivity. Nature. 2004;431:200–205. - PubMed

Publication types

MeSH terms