. 2011 Dec 19;208(13):2615-23.
doi: 10.1084/jem.20110398. Epub 2011 Dec 5.

TAK1 in brain endothelial cells mediates fever and lethargy

Affiliations

TAK1 in brain endothelial cells mediates fever and lethargy

Dirk A Ridder et al. J Exp Med. .

Abstract

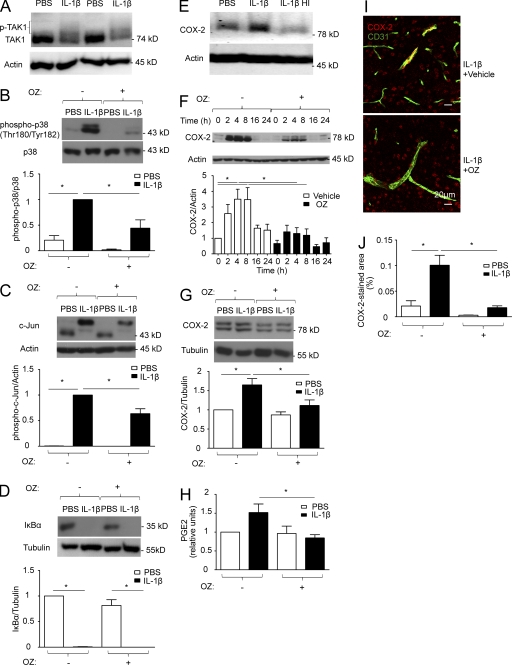
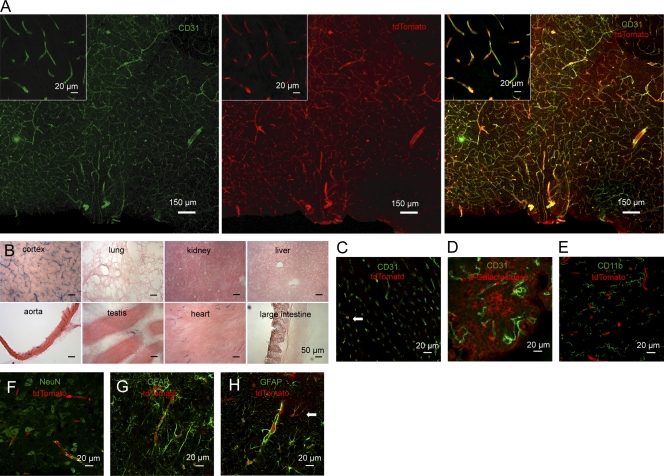
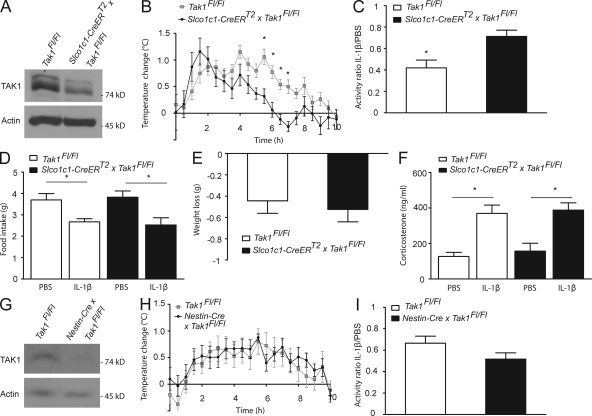
Systemic inflammation affects the brain, resulting in fever, anorexia, lethargy, and activation of the hypothalamus-pituitary-adrenal axis. How peripheral inflammatory signals reach the brain is still a matter of debate. One possibility is that, in response to inflammatory stimuli, brain endothelial cells in proximity to the thermoregulatory centers produce cyclooxygenase 2 (COX-2) and release prostaglandin E2, causing fever and sickness behavior. We show that expression of the MAP kinase kinase kinase TAK1 in brain endothelial cells is needed for interleukin 1β (IL-1β)-induced COX-2 production. Exploiting the selective expression of the thyroxine transporter Slco1c1 in brain endothelial cells, we generated a mouse line allowing inducible deletion of Tak1 specifically in brain endothelium. Mice lacking the Tak1 gene in brain endothelial cells showed a blunted fever response and reduced lethargy upon intravenous injection of the endogenous pyrogen IL-1β. In conclusion, we demonstrate that TAK1 in brain endothelial cells induces COX-2, most likely by activating p38 MAPK and c-Jun, and is necessary for fever and sickness behavior.


Figures

Figure 1.
Figure 1.
In response to IL-1β, TAK1 activates p38 MAPK and c-Jun and induces COX-2 and PGE2 in brain endothelial cells. (A) PBECs were pretreated for 30 min with 250 nM okadaic acid to prevent rapid TAK1 dephosphorylation and then stimulated with 50 ng/ml PBS or IL-1β for 10 min. Protein lysates were analyzed by Western blotting. A representative blot out of three independent experiments showing two samples per treatment group is displayed. (B–D) PBECs were stimulated with 50 ng/ml PBS or IL-1β for 30 min with or without 30-min pretreatment with 600 nM of the TAK1 inhibitor OZ. Protein lysates were analyzed by Western blotting to determine the phosphorylation of p38 MAPK, the band shift of c-Jun indicating its phosphorylation, and the degradation of IκBα. Densitometric quantifications are shown below the blots (n = 4–6). (E) bEnd.3 cells were stimulated with 50 ng/ml PBS, IL-1β, or heat-inactivated IL-1β (IL-1β HI) for 2 h. COX-2 induction was analyzed by Western blotting. A representative example of two independent experiments is shown. IL-1β significantly (P < 0.05) induced COX-2 expression (densitometric COX-2/actin ratio 1.46 ± 0.14) compared with the PBS-group (1.00 ± 0.09) and the IL-1β HI–stimulated group (0.87 ± 0.11). IL-1β was heat inactivated at 90 °C for 60 min. (F) bEnd.3 cells were stimulated with 50 ng/ml PBS or IL-1β for the indicated time period with or without 600 nM OZ. COX-2 induction was monitored by Western blotting. Densitometric quantifications are shown below the blot (n = 4). (G) PBECs were stimulated with 50 ng/ml IL-1β for 2 h with or without 30-min pretreatment with 600 nM OZ. Protein lysates were analyzed by Western blotting to detect COX-2. Densitometric quantifications are shown below the blot (n = 4). (H) PGE2 release by bEnd.3 cells was measured by ELISA 4 h after stimulation with 50 ng/ml IL-1β, with or without 30-min pretreatment with 600 nM OZ (n = 5). PGE2 levels are expressed as units relative to the untreated control. (I and J) Wild-type mice received i.p. injections of 30 mg/kg OZ or vehicle 30 min before administration of 30 µg/kg IL-1β i.v. or PBS. 3 h later, the preoptic area was subject to immunostaining with antibodies against COX-2 and CD31. (I) Representative staining. (J) Quantification of the COX-2 and CD31 double-positive area (normalized to the total area). n = 3–5 mice per group. (B–D, F–H, and J) Pooled data of at least two independent experiments are shown. Values are means ± SEM. *, P < 0.05 (one-way ANOVA, Tukey’s post hoc test).
Figure 2.
Figure 2.
Brain endothelial-specific recombination in Slco1c1-CreERT2 mice. (A) The preoptic area of Slco1c1-CreERT2; Ai14 mice treated with tamoxifen was subjected to immunostaining with anti-CD31. tdTomato reporter is shown in the middle. Representative stainings from three independent experiments are shown. (B) Histochemical β-Galactosidase staining of several organs of Slco1c1-CreERT2; Rosa26 mice treated with tamoxifen. Representative stainings from three independent experiments are shown. (C) Heart cryosections of tamoxifen-treated Slco1c1-CreERT2; Ai14 reporter mice stained with anti-CD31. 3.2 ± 1.6% of all CD31-positive endothelial cells in the heart were expressing the reporter tdTomato (arrow). Representative stainings from two independent experiments are shown. (D) Immunostaining of brain cryosections of tamoxifen-treated Slco1c1-CreERT2; Rosa26 mice with anti–β-Galactosidase and anti-CD31 to analyze recombination in epithelial and in endothelial cells of the choroid plexus. Representative stainings from two independent experiments are shown. (E–G) Immunofluorescent staining for CD11b, NeuN, and GFAP to determine potential recombination in macrophages/microglia, neurons, and astrocytes in the preoptic area of Slco1c1-CreERT2; Ai14 reporter mice, treated with tamoxifen. Representative stainings from three independent experiments are shown. (H) The cortex of Slco1c1-CreERT2; Ai14 reporter mice treated with tamoxifen was subjected to immunostaining with anti-GFAP. tdTomato showed recombination in endothelial cells surrounded by GFAP-positive astrocytic end-feet. In addition, in the cortex a small number of astrocytes had undergone recombination (arrow). Representative stainings from three independent experiments are shown.
Figure 3.
Figure 3.
Slco1c1-CreERT2 x Tak1Fl/Fl mice show a blunted fever response and reduced sickness behavior upon stimulation with IL-1β. (A) Lysates of PBECs from indicated mice were analyzed by Western blotting. One out of three independent experiments is demonstrated. (B) The rise in body temperature in Slco1c1-CreERT2 × Tak1Fl/Fl mice in comparison to control Tak1Fl/Fl mice (n = 7–8 per genotype) upon administration of 30 µg/kg IL-1β i.v. Values are means ± SEM. *, P < 0.05 (repeated measures two-way ANOVA and Bonferroni’s post-test). Pooled data of two independent experiments are shown. (C) IL-1β (30 µg/kg) influence on locomotor activity of Slco1c1-CreERT2 × Tak1Fl/Fl mice and control Tak1Fl/Fl mice (n = 7–8 per group). The ratio of the activity of IL-1β– and PBS-injected animals in the dark phase is shown. Values are means ± SEM. *, P < 0.05 (Student’s t test). (D) IL-1β administration influence on food intake over 22 h in Slco1c1-CreERT2 × Tak1Fl/Fl mice and Tak1Fl/Fl mice. Values are means ± SEM. *, P < 0.05 (one-way ANOVA, Tukey’s post hoc test). (E) Weight loss of Slco1c1-CreERT2 × Tak1Fl/Fl mice and control Tak1Fl/Fl mice over 22 h after i.v. administration of IL-1β. Values are means ± SEM. (F) Plasma corticosterone levels 3 h after IL-1β and PBS administration in Slco1c1-CreERT2 × Tak1Fl/Fl mice and control Tak1Fl/Fl mice. Values are means ± SEM (n = 6–7 animals per group). *, P < 0.05 (one-way ANOVA, Tukey’s post hoc test). Pooled data of two independent experiments are shown. (G) Lysates from the hypothalamus of mice deficient for Tak1 in neurons, oligodendrocytes, and astrocytes (Nestin-Cre × Tak1Fl/Fl mice) and Tak1Fl/Fl mice were analyzed by Western blotting. One out of two independent experiments is shown. (H) The rise in body temperature in Nestin-Cre × Tak1Fl/Fl mice in comparison with Tak1Fl/Fl mice (n = 8 per genotype) upon administration of 30 µg/kg IL-1β i.v. Values are means ± SEM. Pooled data of two independent experiments are shown. (I) IL-1β (30 µg/kg) influence on locomotor activity of Nestin-Cre × Tak1Fl/Fl mice and control Tak1Fl/Fl mice (n = 8 per group). The ratio of the activity of IL-1β and PBS injected animals in the dark phase is shown. Values are means ± SEM.

Similar articles

Cited by

References

    1. Bret-Dibat J.L., Bluthé R.M., Kent S., Kelley K.W., Dantzer R. 1995. Lipopolysaccharide and interleukin-1 depress food-motivated behavior in mice by a vagal-mediated mechanism. Brain Behav. Immun. 9:242–246 10.1006/brbi.1995.1023 - DOI - PubMed
    1. Chakravarty S., Herkenham M. 2005. Toll-like receptor 4 on nonhematopoietic cells sustains CNS inflammation during endotoxemia, independent of systemic cytokines. J. Neurosci. 25:1788–1796 10.1523/JNEUROSCI.4268-04.2005 - DOI - PMC - PubMed
    1. Ching S., Zhang H., Belevych N., He L., Lai W., Pu X.A., Jaeger L.B., Chen Q., Quan N. 2007. Endothelial-specific knockdown of interleukin-1 (IL-1) type 1 receptor differentially alters CNS responses to IL-1 depending on its route of administration. J. Neurosci. 27:10476–10486 10.1523/JNEUROSCI.3357-07.2007 - DOI - PMC - PubMed
    1. Dantzer R., O’Connor J.C., Freund G.G., Johnson R.W., Kelley K.W. 2008. From inflammation to sickness and depression: when the immune system subjugates the brain. Nat. Rev. Neurosci. 9:46–56 10.1038/nrn2297 - DOI - PMC - PubMed
    1. Ding J., Song D., Ye X., Liu S.F. 2009. A pivotal role of endothelial-specific NF-kappaB signaling in the pathogenesis of septic shock and septic vascular dysfunction. J. Immunol. 183:4031–4038 10.4049/jimmunol.0900105 - DOI - PMC - PubMed

Publication types

MeSH terms