. 2011 Dec 19;208(13):2733-46.
doi: 10.1084/jem.20111155. Epub 2011 Dec 5.

Immature B cells preferentially switch to IgE with increased direct Sμ to Sε recombination

Affiliations

Immature B cells preferentially switch to IgE with increased direct Sμ to Sε recombination

Duane R Wesemann et al. J Exp Med. .

Abstract

Immunoglobulin heavy chain (IgH) class-switch recombination (CSR) replaces initially expressed Cμ (IgM) constant regions (C(H)) exons with downstream C(H) exons. Stimulation of B cells with anti-CD40 plus interleukin-4 induces CSR from Cμ to Cγ1 (IgG1) and Cε (IgE), the latter of which contributes to the pathogenesis of atopic diseases. Although Cε CSR can occur directly from Cμ, most mature peripheral B cells undergo CSR to Cε indirectly, namely from Cμ to Cγ1, and subsequently to Cε. Physiological mechanisms that influence CSR to Cγ1 versus Cε are incompletely understood. In this study, we report a role for B cell developmental maturity in IgE CSR. Based in part on a novel flow cytometric IgE CSR assay, we show that immature B cells preferentially switch to IgE versus IgG1 through a mechanism involving increased direct CSR from Cμ to Cε. Our findings suggest that IgE dysregulation in certain immunodeficiencies may be related to impaired B cell maturation.


Figures

Figure 1.
Figure 1.
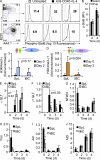
Fetal liver-derived IBCs display IgE CSR preference. (A) WT BALB/c fetal liver cells from embryonic day 15 were cultured in the presence of IL-7–producing T220 fibroblasts for 7 d to form IBCs. These cells were subjected to B220+ magnetic separation and compared with adult splenic B cells purified in the same way. Immunophenotyping with the indicated surface markers is shown. (B) IgG1 and IgE stains of unstimulated adult splenic B cells and IBCs. (C and D) Graphs showing total number of live B cells in millions (C) and percent death rates by trypan blue inclusion (D) during activation with αCD40 plus IL-4. The experiments in A–D are representative of three independent experiments. (E) B220+ purified adult splenic B cells, IBCs, and BM B cells were then stimulated with αCD40 plus IL-4 for 4 d, followed by fusion with the NS-1 myeloma cell line. Hybridoma clones were analyzed by ELISA for IgM, IgG1, and IgE secretion. Shown are the mean values ± SD for three independent experiments. Over 100 clones were analyzed per experiment. The p-values were calculated using the two-tailed Student’s t test.
Figure 2.
Figure 2.
Splenic B cells from young mice and adult transitional B cells preferentially switch to IgE. (A) Splenocytes from BALB/c mice age 4 mo versus 3.5 wk were enriched by B220+ selection before stimulation with αCD40 plus IL-4. Activated B cells were fused to NS-1 myeloma cells. Class switching was assessed by ELISA analysis of hybridoma clones. (B) Adult splenic B cells were enriched by CD43 selection before another round of AA4.1+ separation. Shown is a representative example of a FACS plot of purified B cells that was performed independently three times. (C) Bar graph showing mean percentage ± SD of purified B cells expressing AA4.1 in AA4.1-enriched versus AA4.1-depleted fractions. (D) AA4.1-enriched versus -depleted fractions were stimulated, processed, and analyzed as in A. Shown are mean values ± SD. Each experiment shown was independently performed three times. Over 100 clones were analyzed per experiment. The p-values were calculated using the two-tailed Student’s t test.
Figure 3.
Figure 3.
Different kinetics of CSR to IgE in IBCs versus mature B cells. (A) Development of an assay to assess IgE switching. Activated B cells were subjected to fixation alone, or fixation and permeabilization with or without pretreatment with trypsin before staining for IgE and IgG1. This assay allows for the detection of intracytoplasmic IgE in the absence of receptor-bound (cytophilic) IgE. (B) B cells from BALB/c spleen (top row), IBCs (middle row), or splenic B cells from AID-deficient mice (bottom row) were stimulated with αCD40 plus IL-4. At indicated time points, cells were analyzed for IgG1 and IgE switching using the method outlined in A. (C and D) The experiment in B was independently repeated a total of four times and the mean IgE (C) and IgG1 (D) expression ± SD are shown. The p-values were calculated using the two-tailed Student’s t test.
Figure 4.
Figure 4.
IgE CSR preference in transitional B cells from 1-wk-old mice. (A) B cells from BALB/c adult spleen (top row) or splenic B cells from 1-wk-old BALB/c pups (bottom row) were stained with B220 and AA4.1 (left) and stimulated with αCD40 plus IL-4 for the indicated time points (right). Cells were analyzed for IgG1 and IgE switching using the method outlined in Fig. 3 A. (B and C) The experiment in A was independently repeated a total of three times and the mean IgE (B) and IgG1 (C) expression ± SD are shown. The p-values were calculated using the two-tailed Student’s t test.
Figure 5.
Figure 5.
IgE CSR preference in immature and transitional B cells from other genetic backgrounds. (A) Adult spleen (top row), or IBCs (bottom row) from 129/Sv mice were stimulated with αCD40 plus IL-4. Cells were analyzed for IgG1 and IgE switching using the method outlined in Fig. 3A. (B and C) The experiment in A was repeated in parallel for three separate mice, and fetal liver preparations and the mean IgE (B) and IgG1 (C) expression ± SD are shown. (D) Splenic B cells from adults (top row) or 1-wk-old pups (bottom row) of C57BL/6 mice were stimulated with αCD40 plus IL-4. Cells were analyzed for IgG1 and IgE switching using the method outlined in Fig. 3 A. (E and F) The experiment in D was performed for three separate mice per group, and the mean IgE (E) and IgG1 (F). Shown are averages ± SD. The p-values were calculated using the two-tailed Student’s t test.
Figure 6.
Figure 6.
Decreased Stat6 phosphorylation and Iγ1 GLTs in activated IBCs versus mature B cells. (A) B220-enriched cells were separated from fresh WT mouse spleens (SpL) or from day 8 WT fetal liver cultures (IBC) and either left unstimulated or stimulated with αCD40 and IL-4 for the indicated times. Cells were then fixed and stained for intracellular tyrosine-phosphorylated Stat6 and analyzed via FACS. The numerical value displayed is the mean fluorescence intensity (MFI) of the treated sample. This experiment was repeated with nearly identical results. (B) The MFI of anti–phospho-Stat6–stained resting and αCD40+IL-4-activated adult splenic B cells versus transitional B cells from 1-wk-old pups. This experiment was performed in parallel for three independent mice from each group. (C and D) ChIP of resting and αCD40+IL-4-activated mature B cells and IBCs to test for enrichment of ε (C) and γ1 (D) sequences in anti-H3K4me3 precipitates using quantitative PCR. Signals were normalized to input after subtracting out the value of control IgG precipitates. Schematics of the ε (C) γ1 (D) loci show the location of the primers relative to promoter (P), I, and S regions. The ChIP experiments were performed on five independent samples per group. (E–J) Quantitative PCR (qPCR) for the indicated transcripts at the indicated time points after αCD40 plus IL-4 stimulation. The values presented in E–J represent relative levels of expression of the indicated transcripts normalized to GAPDH expression. Shown are the averages of three independent experiments. The error bars indicate ± SD. The p-values were calculated using the two-tailed Student’s t test. Asterisks indicate statistical significance (P < 0.05).
Figure 7.
Figure 7.
Assessment of Bcl6 and ID2 transcript levels in IBCs compared with splenic B cells. Quantitative PCR for Bcl6 (A) and ID2 (B) expression was performed on samples from unstimulated and αCD40+IL-4–activated splenic B cells and IBCs. (C) Quantitative PCR of Bcl6 expression in WT IBCs versus IBCs from mice heterozygous for the Iμ-Bcl6 transgene. Values were normalized to GAPDH. Shown are mean values ± SD of three independent experiments. The p-values were calculated using the two-tailed Student’s t test. (D) IBCs from WT mice (top row), and IBCs from Iμ-Bcl6 transgenic mice (bottom row) were stimulated with αCD40+IL-4. Cells were analyzed for IgG1 and IgE switching using the intracytoplasmic staining method outlined in Fig. 3 A. The experiment in D was repeated a total of three times from three independent samples per group and the mean IgE (E) and IgG1 (F) expression ± SD for are shown.
Figure 8.
Figure 8.
Increased direct IgM to IgE CSR in IBCs. (A) Simplified schematic of the IgH locus showing class switch recombination products resulting from direct Sμ to Sε recombination. General location of PCR primers in Iε and Cμ are shown as half arrows. (B and C) PCR assay showing excision circle transcript signals unique to transcripts only from direct μ to ε (top lanes) or direct μ to γ1 (middle lanes) CSR from adult splenic B cells versus IBCs after 2 (B) or 4 d (C) of culture. Actin was used as a loading control (bottom lanes). Results are representative of three independent experiments. (D and E) Quantification of densitometry of direct μ to ε CSR. Fold induction was calculated by measuring fold change compared with adult splenic B cells on day 2 (D) and 4 (E). Shown are mean values ± SD for three independent experiments. The p-values were calculated using the two-tailed Student’s t test. (F–H) The intracytoplasmic staining technique described in Fig. 3 A was used to simultaneously detect expression of IgE and IgM (F), as well as simultaneous IgE and IgG1 expression (shown in Fig. 3 B) on αCD40 plus IL-4–activated B cells for the indicated times. (G and H) Line graphs show percent IgE, IgM double-positive B cells (G) and percent IgG1, IgE double-positive B cells (H) in activated adult splenic B cells compared with IBCs. Shown are mean values ± SD of three independent experiments. The p-values were calculated using the two-tailed Student’s t test. Asterisks indicate statistical significance (P < 0.05).
Figure 9.
Figure 9.
Increased IgE, IgM double-positive cells in αCD40+IL-4-activated transitional B cells. (A) The intracytoplasmic staining technique described in Fig. 3 A was used to simultaneously detect expression of IgE and IgM (A), as well as simultaneous IgE and IgG1 expression (shown in Fig. 4 A) in adult splenic B cells versus transitional B cells from 1-wk-old mouse pups. (B and C) Line graphs show percent IgE, IgM double-positive B cells (B), and percent IgG1+IgE double-positive B cells (C) in activated adult splenic B cells compared with transitional B cells. Shown are mean values ± SD of three independent experiments. The p-values were calculated using the two-tailed Student’s t test. Asterisks indicate statistical significance (P < 0.05).
Figure 10.
Figure 10.
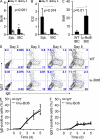
Peripheral Rag1S723C B lineage cells exhibit CSR preference to IgE. (A) Rag1 S723C splenic (SpL) cells and cells from WT littermate control spleen and BM were stained for CD19 (to define B lineage cells) and AA4.1. The plots shown are representative of four experiments. (B) WT and Rag1 S723C B cells were purified based on B220+ or CD19+ selection before being stimulated for 4 d with αCD40 plus IL-4. They were then fused with the NS-1 myeloma fusion partner. Individual hybridoma clones were then assayed for IgG1, IgE, and IgM secretion by ELISA. Shown are mean values ± SD for four independent experiments. The p-values were calculated using two-tailed Student’s t test. Asterisks indicate statistical significance (P < 0.05).

Similar articles

Cited by

  • Primary atopic disorders.
    Lyons JJ, Milner JD. Lyons JJ, et al. J Exp Med. 2018 Apr 2;215(4):1009-1022. doi: 10.1084/jem.20172306. Epub 2018 Mar 16. J Exp Med. 2018. PMID: 29549114 Free PMC article. Review.
  • Unraveling the repertoire in Wiskott-Aldrich syndrome.
    Petersen SH, Sendel A, van der Burg M, Westerberg LS. Petersen SH, et al. Front Immunol. 2014 Oct 27;5:539. doi: 10.3389/fimmu.2014.00539. eCollection 2014. Front Immunol. 2014. PMID: 25386182 Free PMC article. Review. No abstract available.
  • IgH isotype-specific B cell receptor expression influences B cell fate.
    Tong P, Granato A, Zuo T, Chaudhary N, Zuiani A, Han SS, Donthula R, Shrestha A, Sen D, Magee JM, Gallagher MP, van der Poel CE, Carroll MC, Wesemann DR. Tong P, et al. Proc Natl Acad Sci U S A. 2017 Oct 3;114(40):E8411-E8420. doi: 10.1073/pnas.1704962114. Epub 2017 Sep 18. Proc Natl Acad Sci U S A. 2017. PMID: 28923960 Free PMC article.
  • External stimulation induces the secretion of autophagosome-like vesicles by B cells.
    Kuan YD, Tsai CY, Sakakibara S, Standley DM, Kikutani H. Kuan YD, et al. Autophagy Rep. 2023 Feb 21;2(1):2179287. doi: 10.1080/27694127.2023.2179287. eCollection 2023. Autophagy Rep. 2023. PMID: 40395311 Free PMC article.
  • Regulation of IgE Responses by γδ T Cells.
    Huang Y, Yang Z, McGowan J, Huang H, O'Brien RL, Born WK. Huang Y, et al. Curr Allergy Asthma Rep. 2015 Apr;15(4):13. doi: 10.1007/s11882-015-0519-z. Curr Allergy Asthma Rep. 2015. PMID: 26130476 Review.

References

    1. Akira S., Sugiyama H., Yoshida N., Kikutani H., Yamamura Y., Kishimoto T. 1983. Isotype switching in murine pre-B cell lines. Cell. 34:545–556 10.1016/0092-8674(83)90387-2 - DOI - PubMed
    1. Allman D., Pillai S. 2008. Peripheral B cell subsets. Curr. Opin. Immunol. 20:149–157 10.1016/j.coi.2008.03.014 - DOI - PMC - PubMed
    1. Bacharier L.B., Geha R.S. 2000. Molecular mechanisms of IgE regulation. J. Allergy Clin. Immunol. 105:S547–S558 10.1016/S0091-6749(00)90059-9 - DOI - PubMed
    1. Baskin B., Islam K.B., Evengård B., Emtestam L., Smith C.I. 1997. Direct and sequential switching from mu to epsilon in patients with Schistosoma mansoni infection and atopic dermatitis. Eur. J. Immunol. 27:130–135 10.1002/eji.1830270120 - DOI - PubMed
    1. Bassing C.H., Swat W., Alt F.W. 2002. The mechanism and regulation of chromosomal V(D)J recombination. Cell. 109:S45–S55 10.1016/S0092-8674(02)00675-X - DOI - PubMed

Publication types

MeSH terms