. 2012 Feb;63(3):1095-106.
doi: 10.1093/jxb/err315. Epub 2011 Dec 5.

Light-harvesting chlorophyll a/b-binding proteins are required for stomatal response to abscisic acid in Arabidopsis

Affiliations

Light-harvesting chlorophyll a/b-binding proteins are required for stomatal response to abscisic acid in Arabidopsis

Yan-Hong Xu et al. J Exp Bot. 2012 Feb.

Abstract

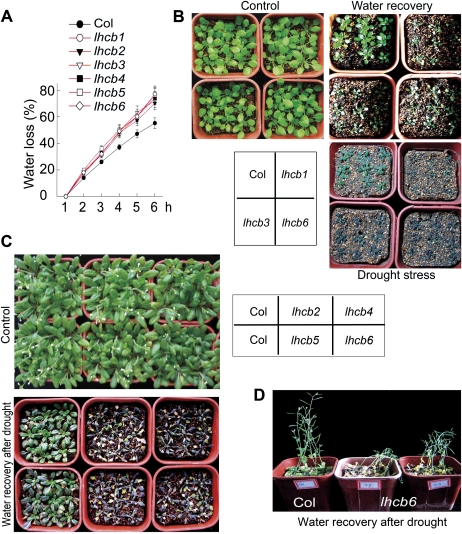
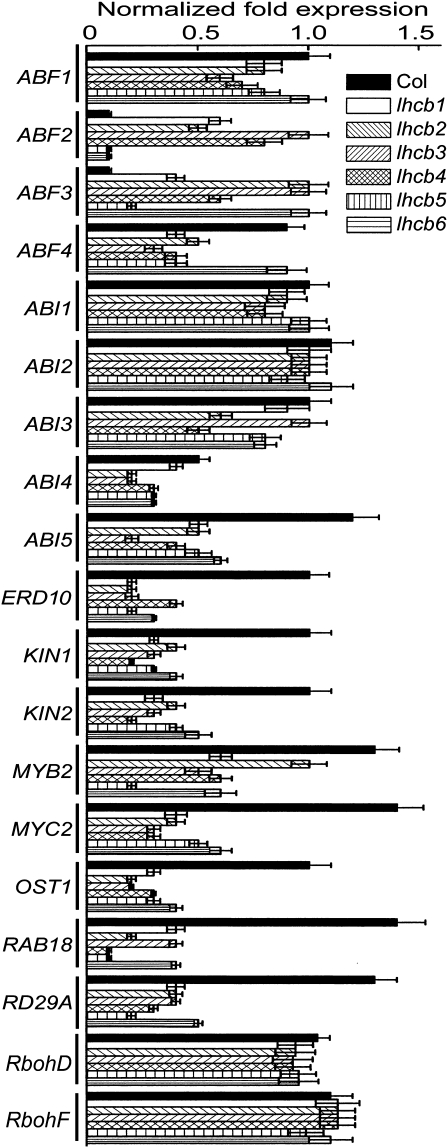
The light-harvesting chlorophyll a/b binding proteins (LHCB) are perhaps the most abundant membrane proteins in nature. It is reported here that the down-regulation or disruption of any member of the LHCB family, LHCB1, LHCB2, LHCB3, LHCB4, LHCB5, or LHCB6, reduces responsiveness of stomatal movement to ABA, and therefore results in a decrease in plant tolerance to drought stress in Arabidopsis thaliana. By contrast, over-expression of a LHCB member, LHCB6, enhances stomatal sensitivity to ABA. In addition, the reactive oxygen species (ROS) homeostasis and a set of ABA-responsive genes are altered in the lhcb mutants. These data demonstrate that LHCBs play a positive role in guard cell signalling in response to ABA and suggest that they may be involved in ABA signalling partly by modulating ROS homeostasis.


Figures

Fig. 1.
Fig. 1.
Molecular and biochemical characterization of the lhcb mutants (from lhcb1 to lhcb6). (A–F) T-DNA insertion sites in lhcb1.1 (SALK_134810) (A), lhcb2.2 (SALK_005614) (B), lhcb3 (SALK_036200) (C), lhcb4.3 (SALK_032779) (D), lhcb5 (SALK_139667) (E), and lhcb6 (SALK_074622) (F). LP, left genomic primer, and RP, right genomic primer with the suffix numbers corresponding to the numbers of the LHCB genes (1 to 6). LBa1, left border primer, and RBa1, right border primer for the flanking sequences of the T-DNA. Boxes and lines represent exons and introns, respectively. The locations of the primers for the identification of the mutants are indicated by arrows. LB and RB represent the left and right border of the T-DNA insertion, respectively; T-DNA1 and T-DNAn, first and last copy of the inserted T-DNAs, respectively, noting that the two or more than two copies were inserted in an inverted manner. (A) One single copy of the T-DNA was inserted into the promoter region at nt –592 to –523 in the 5′-upstream region of the translation start codon (ATG) of the LHCB1.1 gene with a 70 bp fragment deleted in the lhcb1-1 mutant. (B) Tandem T-DNA of two copies (or more than two copies) was inserted into the promoter region in an inverted fashion at the same locus for the lhcb2 mutant, which generates a 24 bp deletion from nt –126 to –102 in the 5′-upstream region of the translation start codon (ATG) of the LHCB2.2 gene. (C) One single copy of T-DNA was inserted into the first exon at nt 120 to 125 of the LHCB3 gene with a 6 bp fragment deleted in the lhcb3 mutant. (D-F) Tandem T-DNA of two copies (or more than two copies) was inserted into the promoter region in an inverted fashion at the same locus for lhcb4.3 (D), lhcb5 (E), and lhcb6 (F) mutants, which generates a 17 bp deletion from nt –1263 to –1247 for lhcb4.3, a 7 bp deletion from nt –483 to –477 for lhcb5, and a 46–bp deletion from nt –391 to –346 in the 5′-upstream region of the translation start codon (ATG) of the corresponding genes LHCB4.3, LHCB5, and LHCB6, respectively. (G) Quantitative real-time PCR analysis (columns) and immunoblotting (protein bands below the columns) for LHCB gene expression in the mutants (from lhcb1 to lhcb6). Actin was used as a loading control for immunoblotting. Relative protein band intensities, normalized relative to the intensity of Col, are indicated by numbers in the box below the bands. Expression of all the six numbers of LHCBs (from LHCB1 to LHCB6) was assessed in each mutant, and the red arrow indicates the level of the corresponding mutated LHCB gene. Note that lhcb1-1, lhcb2, lhcb4, lhcb5, and lhcb6 are knockdown mutants in their corresponding genes, while lhcb3 is a knockout mutant in the LHCB3 gene. The immunoblotting assays were repeated three times with independent biological experiments which gave similar results. Each value for real-time PCR is the mean ±SE of three independent biological determinations. (H) The chlorophyll a/b contents are not significantly affected in the mutants (from lhcb1 to lhcb6). Left panel, the concentrations of chloroplast a (Chla) and b (Chlb) and total chlorophyll in the different mutants. Each value is the mean ±SE of three independent biological determinations. Right panel, the status of the seedlings of the different mutants, showing that no chlorophyll-deficient phenotype can be seen for these mutants.
Fig. 2.
Fig. 2.
Down- or up-regulation of members of the LHCB family alters ABA sensitivities in stomatal movement. (A) ABA-induced stomatal closure (top) and inhibition of stomatal opening (bottom) in wild-type Col, ch1-1, cch, lhcb1, lhcb2, and lhcb3 mutants and a complemented line of the lhcb3 mutant (lhcb3/LHCB3). (B) ABA-induced stomatal closure (top) and inhibition of stomatal opening (bottom) in wild-type Col, ch1-1, cch, lhcb4, lhcb5, and lhcb6 mutants and a transgenic LHCB6-over-expressor (LHCB6, line OE5 as described in Supplementary Fig. S2at JXB online). (C) ABA-induced stomatal closure (top) and inhibition of stomatal opening (bottom) in wild-type Col, cch and lhcb6 mutants and a transgenic LHCB6-over-expressiing line in the cch mutant (cch/LHCB6). (D) ABA-induced stomatal closure (top) and inhibition of stomatal opening (bottom) in wild-type Col, cch and lhcb6 single mutants, and lhcb1 lhcb6, and lhcb6 cch double mutants. Values presented in (A) to (D) are the means ±SE from three independent experiments; n=60 apertures per experiment.
Fig. 3.
Fig. 3.
Down-regulation of members of the LHCB family reduces the ability of plants to conserve water. (A) Water loss rates during a 6 h period from the detached leaves of wild-type Col and different lhcb mutants. Values are the means ±SE of five individual plants per genotype. (B, C) Water loss assays with young seedlings for wild-type Col, lhcb1, lhcb3, and lhcb6 mutants (B) or for wild-type Col, lhcb2, lhcb4, lhcb5, and lhcb6 mutants (C). Plants were well watered (Control) or drought-stressed by withholding water for 18 d and then the drought-stressed plants were rewatered (Water recovery) and growth status was recorded 2 d later. The entire experiment was replicated three times with similar results. (D) Assays with mature plants for wild-type Col and lhcb6 mutants. Plants were drought-stressed by withholding water for 21 d and then the plants were rewatered and growth status was recorded 2 d later. The entire experiment was replicated three times with similar results.
Fig. 4.
Fig. 4.
ROS homeostasis is altered in lhcb mutants. (A) ROS production in leaves in response to different concentrations of ABA (from 0–50 μM for Col and 0–10 μM for lhcb mutants), detected by nitroblue tetrazolium staining in wild-type Col and different lhcb mutants. The entire experiment was replicated five times with similar results. (B) Quantitative estimation of the ROS production described in (A). Relative ROS-staining intensities estimated by scanning the staining profiles, are normalized relative to the ROS-staining intensity of Col (taken as 100%). Each value is the mean ±SE of five independent biological determinations. (C) ROS production from guard cells in response to ABA (5 μM), examined by H2DCF-DA imaging in wild-type Col and different lhcb mutants. The entire experiment was replicated three times with similar results. For the stomatal apertures of the treated plants, see Supplementary Fig. S5 at JXB online.
Fig. 5.
Fig. 5.
Expression of a set of ABA-responsive genes is altered in lhcb mutants. Gene expression was assayed by real-time PCR. Each value is the mean ±SE of three independent biological determinations.

Similar articles

Cited by

References

    1. Abe H, Urao T, Ito T, Seki M, Shinozaki K, Yamaguchi-Shinozaki K. Arabidopsis AtMYC2 (bHLH) and AtMYB2 (MYB) function as transcription activators in abscisic acid signaling. The Plant Cell. 2003;15:63–78. - PMC - PubMed
    1. Adam Z. Protein stability and degradation in chloroplasts. Plant Molecular Biology. 1996;32:773–783. - PubMed
    1. Adie BAT, Perez-Perez J, Perez-Perez MM, Godoy M, Sanchez-Serrano JJ, Schmelz EA, Solanoa R. ABA is an essential signal for plant resistance to pathogens affecting JA biosynthesis and the activation of defenses in Arabidopsis. The Plant Cell. 2007;19:1665–1681. - PMC - PubMed
    1. Alabadi D, Oyama T, Yanovsky MJ, Harmon FG, Mas P, Kay SA. Reciprocal regulation between TOC1 and LHY/ CCA1 within the Arabidopsis circadian clock. Science. 2001;293:880–883. - PubMed
    1. Andersson J, Walters RG, Horton P, Jansson S. Antisense inhibition of the photosynthetic antenna proteins CP29 and CP26: Implications for the mechanism of protective energy dissipation. The Plant Cell. 2001;13:1193–1204. - PMC - PubMed

Publication types

MeSH terms