. 2012 Feb;190(2):709-23.
doi: 10.1534/genetics.111.136721. Epub 2011 Dec 5.

Scrambling eggs: meiotic drive and the evolution of female recombination rates

Affiliations

Scrambling eggs: meiotic drive and the evolution of female recombination rates

Yaniv Brandvain et al. Genetics. 2012 Feb.

Abstract

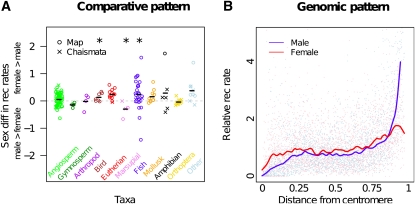
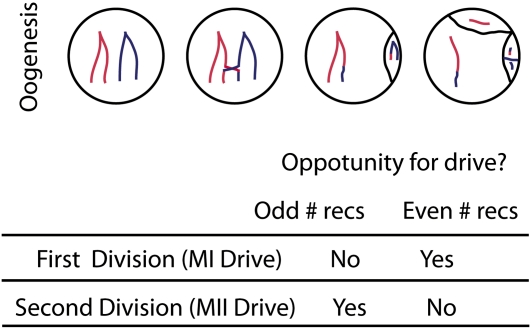
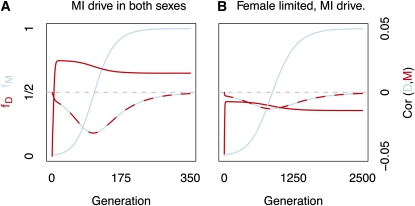
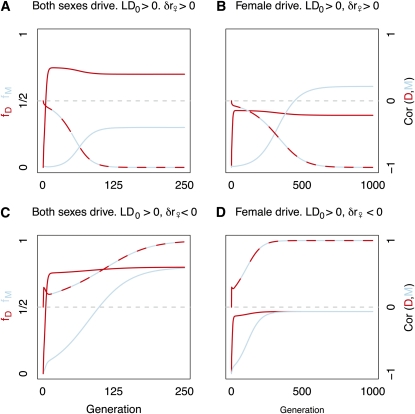
Theories to explain the prevalence of sex and recombination have long been a central theme of evolutionary biology. Yet despite decades of attention dedicated to the evolution of sex and recombination, the widespread pattern of sex differences in the recombination rate is not well understood and has received relatively little theoretical attention. Here, we argue that female meiotic drivers--alleles that increase in frequency by exploiting the asymmetric cell division of oogenesis--present a potent selective pressure favoring the modification of the female recombination rate. Because recombination plays a central role in shaping patterns of variation within and among dyads, modifiers of the female recombination rate can function as potent suppressors or enhancers of female meiotic drive. We show that when female recombination modifiers are unlinked to female drivers, recombination modifiers that suppress harmful female drive can spread. By contrast, a recombination modifier tightly linked to a driver can increase in frequency by enhancing female drive. Our results predict that rapidly evolving female recombination rates, particularly around centromeres, should be a common outcome of meiotic drive. We discuss how selection to modify the efficacy of meiotic drive may contribute to commonly observed patterns of sex differences in recombination.


Figures

Figure 1
Figure 1
Genome-wide and regional sex differences in recombination rates. (A) The difference between female and male recombination rates (○ from linkage maps, excluding known sex chromosomes, and × from chiasmata counts) divided by the sex-averaged rates (see File S1 for data). Symbols above the dashed line indicate higher rates of recombination in females than in males. *P < 0.05, using a two-tailed sign test, without correcting for multiple tests or phylogeny, and ignoring ties. (B) Sex-standardized recombination rates across the human genome. The sex-standardized rate equals the local recombination rate in a given sex (male and female), divided by the average recombination rate in that sex. The x-axis indicates the position of the focal genomic region (0.2% of a chromosome arm), divided by the length of the chromosome arm. Data are presented from all metacentric human autosomes. Lines represent a lowess smoothing of these points.
Figure 2
Figure 2
Recombination during oogenesis and the opportunity for meiotic drive. Only one of the four products of female meiosis is included in the egg. Recombination is a critical determinant for the opportunity for drive because it partitions variation within and among the products of the first meiotic division (dyads). With recombination between the marker and the centromere, there is variation within but not among dyads, presenting an opportunity for drive during MII but not MI. When recombination occurs after the marker, there is variation among but not within dyads, presenting an opportunity for drive during MI but not MII.
Figure 3
Figure 3
The coevolution of an MI driver and an unlinked recombination enhancer. The frequencies of MI drive alleles (fD, red) and unlinked recombination modifiers (fM, blue) across generations are shown. The correlation between alleles, LD/fDfdfMfm, denoted by the red and blue line, and its value are given on the right axis. Drive is complete and recessive lethal (wDd = 1, wdd = 0). The initial recombination rate is 14, and each copy of M increases the probability of recombining by 0.05. Initial frequencies of drive and recombination modifier alleles equal fD0=0.10 and fM0=0.01, respectively. (A) Drive in both sexes (MI = 1, r = 14, δr = 0.05). (B) Female-limited drive (αMI♀ = 1,δr = 0.05).
Figure 4
Figure 4
The evolution of drivers and recombination modifiers in tight linkage. The frequencies of MI drivers (fD, red), and linked recombination modifiers (fM, blue) across generations are shown. The correlation between alleles is denoted by the red and blue line, and its value is given on the right axis. Initial frequencies of driver and recombination modifier alleles are fD0=0.10 and fM0=0.01, respectively. Drive is complete and recessive lethal. Initial recombination rate equals 14. (A) Drivers and recombination enhancement in both sexes (δr = 0.05); M arises on a d chromosome. (B) Female-limited driver and recombination enhancement. (δr = 0.05); M arises on a d chromosome. (C) Drivers and recombination suppression in both sexes (δr = –0.05); M arises on a D chromosome. (D) Female-limited driver and recombination suppression (δr = –0.05); M arises on a D chromosome.
Figure 5
Figure 5
The coevolution recombination modifiers and a two-locus drive system. The frequencies of drive enhancer, centromeric driver, and recombination modifier alleles are displayed in red, green, and blue, respectively. The correlation between recombination modifier and centromeric driver alleles is denoted by the green and blue line, and its value is given on the right axis in B (the scale is maintained in C). Initial frequencies of drive and recombination modifier alleles equal fD0=0.10 and fM0=0.01, respectively. The driving centromeric allele completely distorts meiosis in DD and Dd genotypes (e.g., α1 = α2 = 1) and is a recessive lethal. Neither drive enhancer nor recombination modifier directly influences individual fitness. The initial recombination rate and allele frequencies are r = 0.10 and fD(0) = fC(0) = fM(0) = 0.001, respectively. (A) Recombination modification in both sexes (δr = 0.025, δr = 0.025). (B) Female-limited recombination modification (δr = 0.025, δr = 0). (C) Male-limited recombination modification (δr = 0, δr = 0.025). (D) The modifier has distinct influence on male and female recombination rates (δr and δr, respectively). Green indicates an increase in modifier frequency, and purple indicates a decrease. Labels above diagonal lines describe the relative change in allele frequencies over 250 generations.

Similar articles

Cited by

References

    1. Anderson J. A., Song Y. S., Langley C. H., 2008. Molecular population genetics of Drosophila subtelomeric DNA. Genetics 178: 477–487 - PMC - PubMed
    1. Anderson J. A., Gilliland W. D., Langley C. H., 2009. Molecular population genetics and evolution of Drosophila meiosis genes. Genetics 181: 177–185 - PMC - PubMed
    1. Aparicio J. M., Ortego J., Calabuig G., Cordero P. J., 2010. Evidence of subtle departures from Mendelian segregation in a wild lesser kestrel (Falco naumanni) population. Heredity 105(2): 213–219 - PubMed
    1. Axelsson E., Albrechtsen A., Van A. P., Li L., Megens H. J., et al. , 2010. Segregation distortion in chicken and the evolutionary consequences of female meiotic drive in birds. Heredity 105(3): 290–298 - PubMed
    1. Barton N. H., 2009. Why sex and recombination? Cold Spring Harbor Symp. Quant. Biol. 74(5385): 187–195 - PubMed

Publication types