Quantitative trait Loci association mapping by imputation of strain origins in multifounder crosses
- PMID: 22143921
- PMCID: PMC3276647
- DOI: 10.1534/genetics.111.135095
Quantitative trait Loci association mapping by imputation of strain origins in multifounder crosses
Abstract
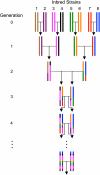
Although mapping quantitative traits in inbred strains is simpler than mapping the analogous traits in humans, classical inbred crosses suffer from reduced genetic diversity compared to experimental designs involving outbred animal populations. Multiple crosses, for example the Complex Trait Consortium's eight-way cross, circumvent these difficulties. However, complex mating schemes and systematic inbreeding raise substantial computational difficulties. Here we present a method for locally imputing the strain origins of each genotyped animal along its genome. Imputed origins then serve as mean effects in a multivariate Gaussian model for testing association between trait levels and local genomic variation. Imputation is a combinatorial process that assigns the maternal and paternal strain origin of each animal on the basis of observed genotypes and prior pedigree information. Without smoothing, imputation is likely to be ill-defined or jump erratically from one strain to another as an animal's genome is traversed. In practice, one expects to see long stretches where strain origins are invariant. Smoothing can be achieved by penalizing strain changes from one marker to the next. A dynamic programming algorithm then solves the strain imputation process in one quick pass through the genome of an animal. Imputation accuracy exceeds 99% in practical examples and leads to high-resolution mapping in simulated and real data. The previous fastest quantitative trait loci (QTL) mapping software for dense genome scans reduced compute times to hours. Our implementation further reduces compute times from hours to minutes with no loss in statistical power. Indeed, power is enhanced for full pedigree data.
Figures


Similar articles
-
Power and precision of QTL mapping in simulated multiple porcine F2 crosses using whole-genome sequence information.BMC Genet. 2018 Apr 3;19(1):22. doi: 10.1186/s12863-018-0604-0. BMC Genet. 2018. PMID: 29614956 Free PMC article.
-
Linkage analysis of quantitative trait loci in multiple line crosses.Genetica. 2002 Apr;114(3):217-30. doi: 10.1023/a:1016296225065. Genetica. 2002. PMID: 12206360
-
A mating advice system in dairy cattle incorporating genomic information.J Dairy Sci. 2019 Sep;102(9):8210-8220. doi: 10.3168/jds.2019-16283. Epub 2019 Jun 20. J Dairy Sci. 2019. PMID: 31229287
-
Analysing complex genetic traits with chromosome substitution strains.Nat Genet. 2000 Mar;24(3):221-5. doi: 10.1038/73427. Nat Genet. 2000. PMID: 10700173 Review.
-
Current progress on statistical methods for mapping quantitative trait loci from inbred line crosses.J Biopharm Stat. 2010 Mar;20(2):454-81. doi: 10.1080/10543400903572845. J Biopharm Stat. 2010. PMID: 20309768 Review.
Cited by
-
Fine-mapping QTLs in advanced intercross lines and other outbred populations.Mamm Genome. 2014 Aug;25(7-8):271-92. doi: 10.1007/s00335-014-9523-1. Epub 2014 Jun 7. Mamm Genome. 2014. PMID: 24906874 Free PMC article. Review.
-
The genetics of gene expression in complex mouse crosses as a tool to study the molecular underpinnings of behavior traits.Mamm Genome. 2014 Feb;25(1-2):12-22. doi: 10.1007/s00335-013-9495-6. Epub 2013 Dec 31. Mamm Genome. 2014. PMID: 24374554 Free PMC article. Review.
-
MAPfastR: quantitative trait loci mapping in outbred line crosses.G3 (Bethesda). 2013 Dec 9;3(12):2147-9. doi: 10.1534/g3.113.008623. G3 (Bethesda). 2013. PMID: 24122053 Free PMC article.
-
Recursive Algorithms for Modeling Genomic Ancestral Origins in a Fixed Pedigree.G3 (Bethesda). 2018 Oct 3;8(10):3231-3245. doi: 10.1534/g3.118.200340. G3 (Bethesda). 2018. PMID: 30068523 Free PMC article.
-
Mendel: the Swiss army knife of genetic analysis programs.Bioinformatics. 2013 Jun 15;29(12):1568-70. doi: 10.1093/bioinformatics/btt187. Epub 2013 Apr 22. Bioinformatics. 2013. PMID: 23610370 Free PMC article.
References
-
- Abecasis G., Cherny S., Cookson W., Cardon L., 2001. Merlin—rapid analysis of dense genetic maps using sparse gene flow trees. Nat. Genet. 30: 97–101 - PubMed
-
- Ayers K., Lange K., 2008. Penalized estimation of haplotype frequencies. Bioinformatics 24: 1596–1602 - PubMed
-
- Bauman L., Almasy L., Blangero J., Duggirala R., Sinsheimer J., et al. , 2005. Fishing for pleiotropic qtls in a polygenic sea. Ann. Hum. Genet. 69: 590–611 - PubMed
Publication types
MeSH terms
Grants and funding
LinkOut - more resources
Full Text Sources

