. 2012 Mar;27(3):654-63.
doi: 10.1002/jbmr.1482.

QCT measures of bone strength at the thoracic and lumbar spine: the Framingham Study

Affiliations

QCT measures of bone strength at the thoracic and lumbar spine: the Framingham Study

Elizabeth J Samelson et al. J Bone Miner Res. 2012 Mar.

Abstract

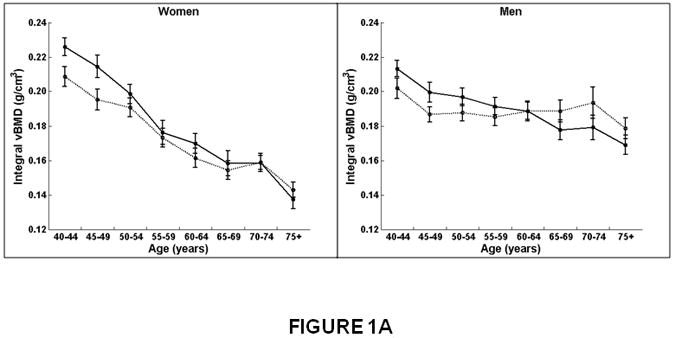
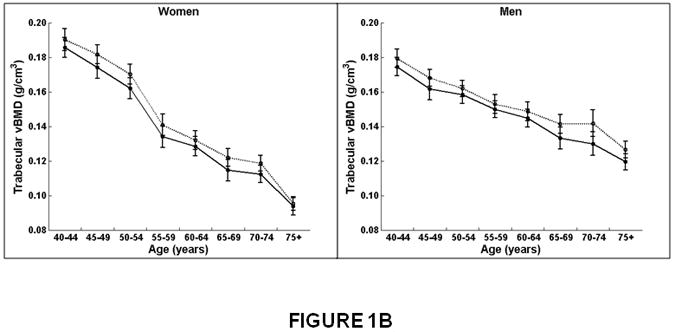
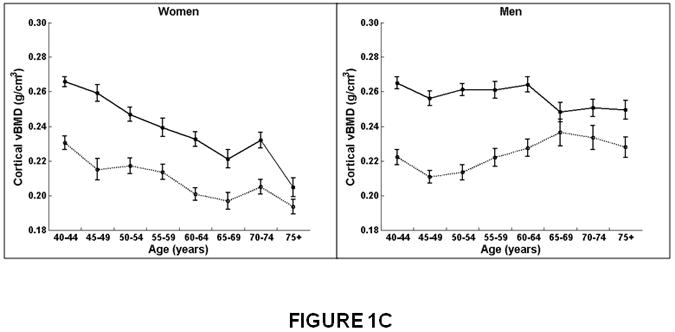
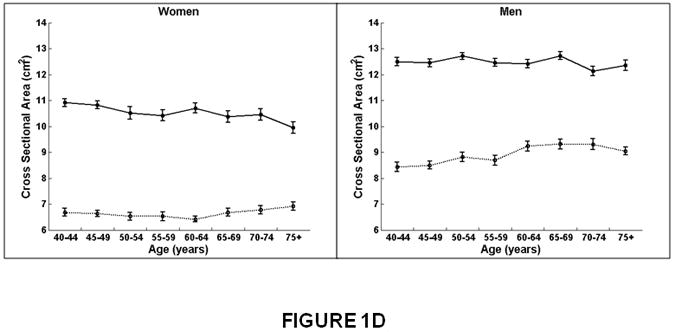
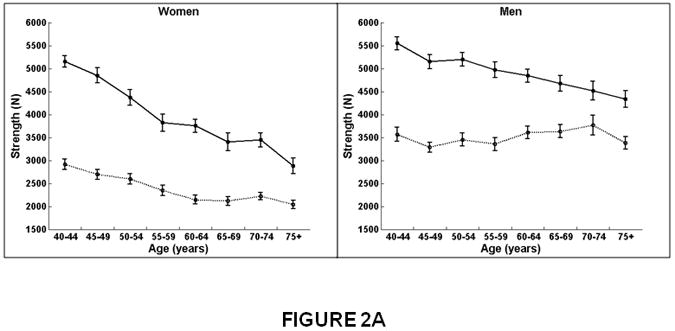
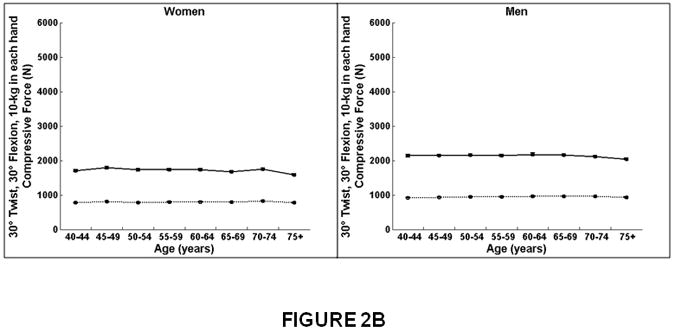
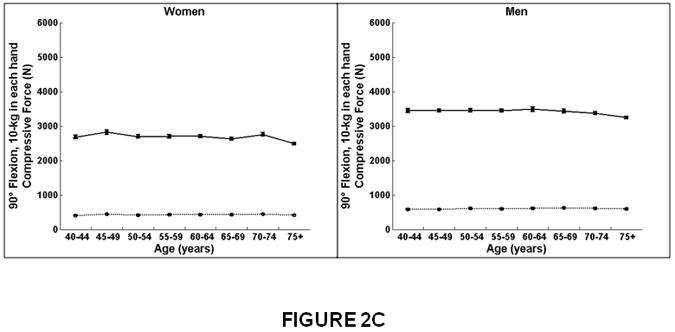
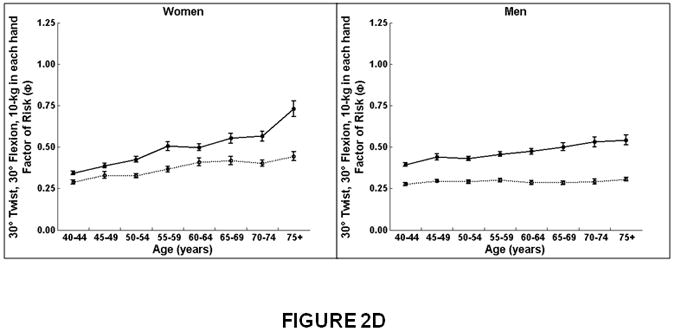
We used volumetric quantitative computed tomography (QCT) scans to evaluate volumetric bone density (vBMD), geometry, and strength in the thoracic (T8 to T10) and lumbar (L3 to L5) spine and determined how these parameters varied with age, sex, and spinal region. Participants included 690 participants of the Framingham Study, 40 to 87 years old (mean, 61 years). In both women and men, trabecular vBMD declined with age similarly for lumbar and thoracic regions, whereas cortical vBMD and integral vBMD, vertebral strength, and compressive force declined more at the lumbar spine than thoracic spine (interaction, p < 0.01). Notably, in men, cortical vBMD increased (β = 0.0004, p = 0.01), and vertebral strength did not change (β = 1.9305, p = 0.66) at the thoracic spine with age. In both women and men, vertebral cross-sectional area increased less and the factor-of-risk increased more with age at the lumbar than at the thoracic region (interaction, p < 0.01). For example, in women, the factor-of-risk for forward flexion increased (worsened) with age 6.8-fold more in the lumbar spine (β = 0.0157), compared with the thoracic spine (β = 0.0023). vBMD and vertebral strength declined more and the factor-of-risk increased more with age in women than men (interaction, p < 0.01). For instance, integral vBMD for the lumbar spine declined 36% from 40 to 75 years of age in women compared with 18% in men. There was little or no age-related change in the forces applied to the thoracic vertebrae in either women or men. Age-related changes were greater in the lumbar spine than in the thoracic region and greater in women than men. Whereas women lost bone density and strength at both the thoracic and lumbar spine, in men, vertebral strength declined only at the lumbar spine. Our study confirms the importance of evaluating determinants of vertebral strength in both the thoracic and lumbar spine and in both women and men to understand mechanisms underlying the structural failure of vertebral bodies with aging.


Figures

Figure 1
Figure 1
Association between age and integral, trabecular, and cortical vBMD, and cross-sectional area for the thoracic (T8-T10) and lumbar (L3-L5) spine in women and men. Mean values for the thoracic and lumbar spine, averaged for T8-T10 and L3-L5, respectively, are shown. Integral and trabecular vBMD declined with increasing age for the lumbar and thoracic spine in women and men. Cortical vBMD declined with increasing age for the lumbar and thoracic spine in women. In men, cortical vBMD declined with increasing age in the lumbar spine but increased with increasing age in the thoracic spine. Cross-sectional area increased with increasing age in the thoracic spine but did not change with increasing age at the lumbar spine in women and men. Women on left, men on right. X-axis, age in years. Y-axis, QCT bone measures, (A) Integral vBMD, (B) Trabecular vBMD, (C) Cortical vBMD, (D) Cross-Sectional Area. Solid line, values for lumbar spine, averaged for L3-L5 vertebral levels. Dotted line, values for thoracic spine, averaged for T8-T10 vertebral levels.
Figure 1
Figure 1
Association between age and integral, trabecular, and cortical vBMD, and cross-sectional area for the thoracic (T8-T10) and lumbar (L3-L5) spine in women and men. Mean values for the thoracic and lumbar spine, averaged for T8-T10 and L3-L5, respectively, are shown. Integral and trabecular vBMD declined with increasing age for the lumbar and thoracic spine in women and men. Cortical vBMD declined with increasing age for the lumbar and thoracic spine in women. In men, cortical vBMD declined with increasing age in the lumbar spine but increased with increasing age in the thoracic spine. Cross-sectional area increased with increasing age in the thoracic spine but did not change with increasing age at the lumbar spine in women and men. Women on left, men on right. X-axis, age in years. Y-axis, QCT bone measures, (A) Integral vBMD, (B) Trabecular vBMD, (C) Cortical vBMD, (D) Cross-Sectional Area. Solid line, values for lumbar spine, averaged for L3-L5 vertebral levels. Dotted line, values for thoracic spine, averaged for T8-T10 vertebral levels.
Figure 2
Figure 2
Association between age and compressive strength, compressive force, and factor-of-risk for the thoracic (T8-T10) and lumbar (L3-L5) spine in women and men. Mean values for the thoracic and lumbar spine, averaged for T8-T10 and L3-L5, respectively, are shown. Compressive strength declined with increasing age for the lumbar and thoracic spine in women. In men, compressive strength declined with increasing age for the lumbar spine but did not change with increasing age for the thoracic spine. Compressive force declined with increasing age for the lumbar spine in women and men but did not change with increasing age at the thoracic spine. Factor-of-risk increased with age for the lumbar and thoracic spine in women, whereas the factor-of-risk increased with age only for the lumbar spine and not in the thoracic spine in men. Women on left, men on right. X-axis, age in years. Y-axis, QCT bone measures, (A) Compressive strength (B) Compressive force, twisting and flexion, (C) Compressive force, standing and flexion, (D) Factor-of-risk, twisting and flexion (E) Factor-of-risk, standing and flexion. Solid line, values for lumbar spine, averaged for L3-L5 vertebral levels. Dotted line, values for thoracic spine, averaged for T8-T10 vertebral levels.
Figure 2
Figure 2
Association between age and compressive strength, compressive force, and factor-of-risk for the thoracic (T8-T10) and lumbar (L3-L5) spine in women and men. Mean values for the thoracic and lumbar spine, averaged for T8-T10 and L3-L5, respectively, are shown. Compressive strength declined with increasing age for the lumbar and thoracic spine in women. In men, compressive strength declined with increasing age for the lumbar spine but did not change with increasing age for the thoracic spine. Compressive force declined with increasing age for the lumbar spine in women and men but did not change with increasing age at the thoracic spine. Factor-of-risk increased with age for the lumbar and thoracic spine in women, whereas the factor-of-risk increased with age only for the lumbar spine and not in the thoracic spine in men. Women on left, men on right. X-axis, age in years. Y-axis, QCT bone measures, (A) Compressive strength (B) Compressive force, twisting and flexion, (C) Compressive force, standing and flexion, (D) Factor-of-risk, twisting and flexion (E) Factor-of-risk, standing and flexion. Solid line, values for lumbar spine, averaged for L3-L5 vertebral levels. Dotted line, values for thoracic spine, averaged for T8-T10 vertebral levels.

Similar articles

Cited by

References

    1. Melton LJd, Lane AW, Cooper C, Eastell R, O'Fallon WM, Riggs BL. Prevalence and incidence of vertebral deformities. Osteoporos Int. 1993;3(3):113–9. - PubMed
    1. Bone Health and Osteoporosis: A Report of the Surgeon General. US Department of Health and Human Services, Office of the Surgeon General; Rockville, MD: 2004. - PubMed
    1. Delmas PD, van de Langerijt L, Watts NB, Eastell R, Genant H, Grauer A, Cahall DL. Underdiagnosis of vertebral fractures is a worldwide problem: the IMPACT study. J Bone Miner Res. 2005;20(4):557–63. - PubMed
    1. Cauley JA, Hochberg MC, Lui LY, Palermo L, Ensrud KE, Hillier TA, Nevitt MC, Cummings SR. Long-term risk of incident vertebral fractures. Jama. 2007;298(23):2761–7. - PubMed
    1. Samelson EJ, Hannan MT, Zhang Y, Genant HK, Felson DT, Kiel DP. Incidence and risk factors for vertebral fracture in women and men: 25-year follow-up results from the population-based Framingham study. J Bone Miner Res. 2006;21(8):1207–14. - PubMed

Publication types