β-Cell subcellular localization of glucose-stimulated Mn uptake by X-ray fluorescence microscopy: implications for pancreatic MRI
- PMID: 22144025
- PMCID: PMC3626438
- DOI: 10.1002/cmmi.447
β-Cell subcellular localization of glucose-stimulated Mn uptake by X-ray fluorescence microscopy: implications for pancreatic MRI
Abstract
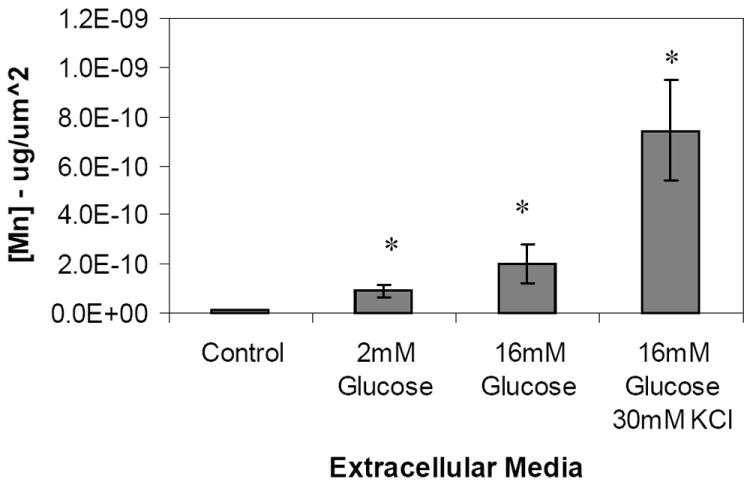
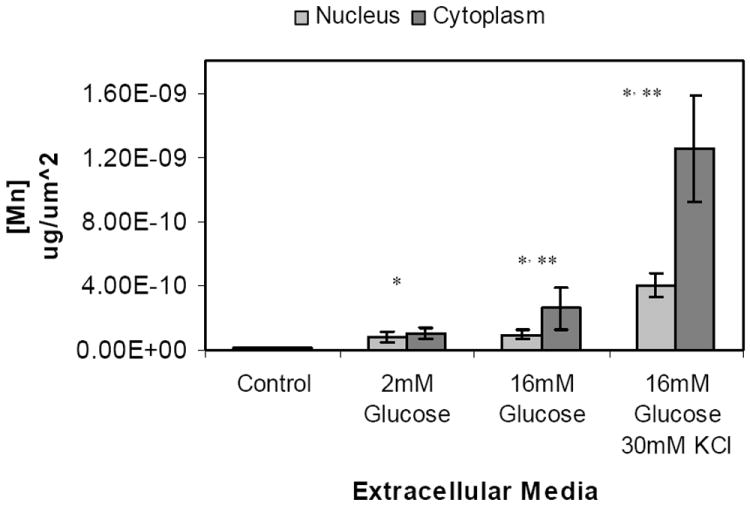
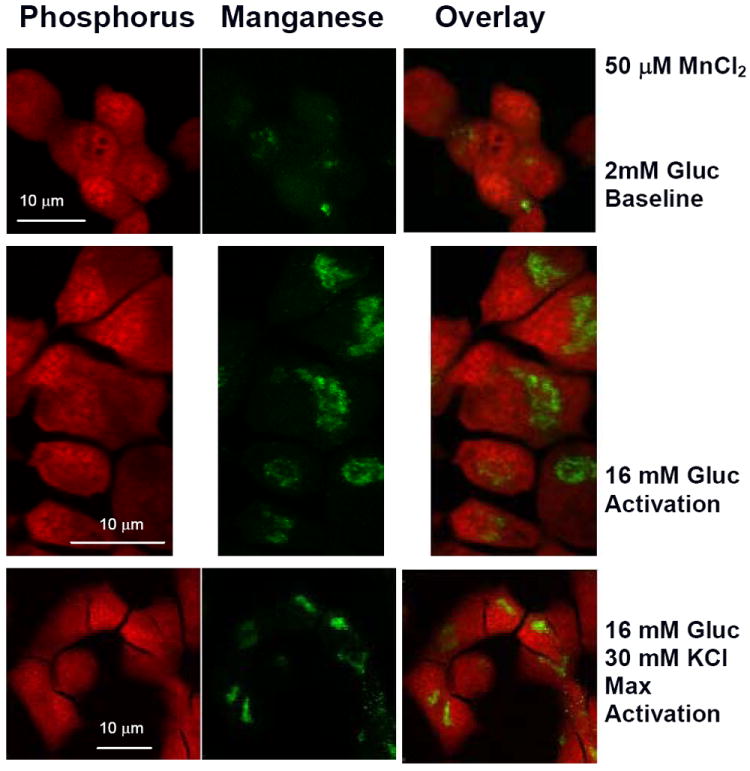
Manganese (Mn) is a calcium (Ca) analog that has long been used as a magnetic resonance imaging (MRI) contrast agent for investigating cardiac tissue functionality, for brain mapping and for neuronal tract tracing studies. Recently, we have extended its use to investigate pancreatic β-cells and showed that, in the presence of MnCl(2), glucose-activated pancreatic islets yield significant signal enhancement in T(1)-weigheted MR images. In this study, we exploited for the first time the unique capabilities of X-ray fluorescence microscopy (XFM) to both visualize and quantify the metal in pancreatic β-cells at cellular and subcellular levels. MIN-6 insulinoma cells grown in standard tissue culture conditions had only a trace amount of Mn, 1.14 ± 0.03 × 10(-11)µg/µm(2), homogenously distributed across the cell. Exposure to 2 mM glucose and 50 µM MnCl(2) for 20 min resulted in nonglucose-dependent Mn uptake and the overall cell concentration increased to 8.99 ± 2.69 × 10(-11) µg/µm(2). When cells were activated by incubation in 16 mM glucose in the presence of 50 µM MnCl(2), a significant increase in cytoplasmic Mn was measured, reaching 2.57 ± 1.34 × 10(-10) µg/µm(2). A further rise in intracellular concentration was measured following KCl-induced depolarization, with concentrations totaling 1.25 ± 0.33 × 10(-9) and 4.02 ± 0.71 × 10(-10) µg/µm(2) in the cytoplasm and nuclei, respectively. In both activated conditions Mn was prevalent in the cytoplasm and localized primarily in a perinuclear region, possibly corresponding to the Golgi apparatus and involving the secretory pathway. These data are consistent with our previous MRI findings, confirming that Mn can be used as a functional imaging reporter of pancreatic β-cell activation and also provide a basis for understanding how subcellular localization of Mn will impact MRI contrast.
Copyright © 2011 John Wiley & Sons, Ltd.
Figures
Similar articles
-
Empirical mathematical model for dynamic manganese-enhanced MRI of the murine pancreas for assessment of β-cell function.Magn Reson Imaging. 2013 May;31(4):508-14. doi: 10.1016/j.mri.2012.09.003. Epub 2012 Oct 25. Magn Reson Imaging. 2013. PMID: 23102946 Free PMC article.
-
Functional MR microimaging of pancreatic beta-cell activation.Cell Transplant. 2006;15(2):195-203. doi: 10.3727/000000006783982151. Cell Transplant. 2006. PMID: 16719054
-
Indirectly probing Ca(2+) handling alterations following myocardial infarction in a murine model using T(1)-mapping manganese-enhanced magnetic resonance imaging.Magn Reson Med. 2011 Jan;65(1):239-49. doi: 10.1002/mrm.22597. Magn Reson Med. 2011. PMID: 20872864
-
X-ray fluorescence microscopy for investigation of archival tissues.Health Phys. 2012 Aug;103(2):181-6. doi: 10.1097/HP.0b013e31824e7023. Health Phys. 2012. PMID: 22951477 Free PMC article. Review.
-
The development and use of metal-based probes for X-ray fluorescence microscopy.Metallomics. 2022 Dec 8;14(12):mfac093. doi: 10.1093/mtomcs/mfac093. Metallomics. 2022. PMID: 36537552 Review.
Cited by
-
Empirical mathematical model for dynamic manganese-enhanced MRI of the murine pancreas for assessment of β-cell function.Magn Reson Imaging. 2013 May;31(4):508-14. doi: 10.1016/j.mri.2012.09.003. Epub 2012 Oct 25. Magn Reson Imaging. 2013. PMID: 23102946 Free PMC article.
-
Targets and probes for non-invasive imaging of β-cells.Eur J Nucl Med Mol Imaging. 2017 Apr;44(4):712-727. doi: 10.1007/s00259-016-3592-1. Epub 2016 Dec 26. Eur J Nucl Med Mol Imaging. 2017. PMID: 28025655 Free PMC article. Review.
-
PET/MRI enables simultaneous in vivo quantification of β-cell mass and function.Theranostics. 2020 Jan 1;10(1):398-410. doi: 10.7150/thno.33410. eCollection 2020. Theranostics. 2020. PMID: 31903128 Free PMC article.
-
Experimental demonstration of novel imaging geometries for x-ray fluorescence computed tomography.Med Phys. 2013 Jun;40(6):061903. doi: 10.1118/1.4801907. Med Phys. 2013. PMID: 23718594 Free PMC article.
-
Pancreatic magnetic resonance imaging after manganese injection distinguishes type 2 diabetic and normoglycemic patients.Islets. 2012 May-Jun;4(3):243-8. doi: 10.4161/isl.20857. Epub 2012 May 1. Islets. 2012. PMID: 22722479 Free PMC article.
References
-
- de Sousa PL, de Souza SL, Silva AC, de Souza RE, de Castro RM. Manganese-enhanced magnetic resonance imaging (MEMRI) of rat brain after systemic administration of MnCl2: changes in T1 relaxation times during postnatal development. J Magn Reson Imaging. 2007;25(1):32–8. doi: 10.1002/jmri.20792. - DOI - PubMed
-
- Dryselius S, Grapengiesser E, Hellman B, Gylfe E. Voltage-dependent entry and generation of slow Ca2+ oscillations in glucose-stimulated pancreatic beta-cells. Am J Physiol. 1999;276(3 Pt 1):E512–8. - PubMed
Publication types
MeSH terms
Substances
Grants and funding
LinkOut - more resources
Full Text Sources
Medical