

Nutrigenomics of hepatic steatosis in a feline model: effect of monosodium glutamate, fructose, and Trans-fat feeding
- PMID: 22144172
- PMCID: PMC3316754
- DOI: 10.1007/s12263-011-0261-7
Nutrigenomics of hepatic steatosis in a feline model: effect of monosodium glutamate, fructose, and Trans-fat feeding
Abstract
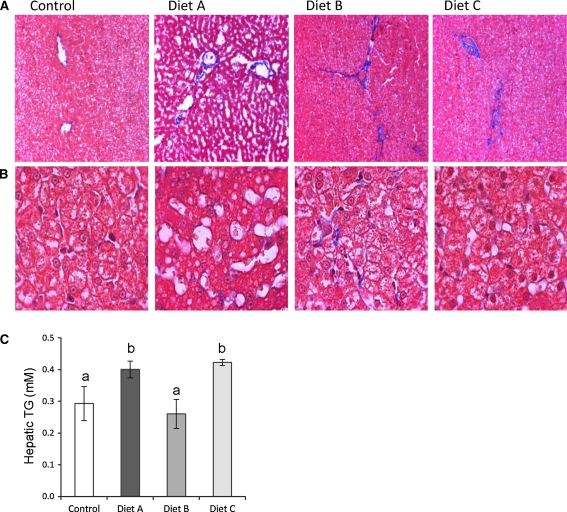
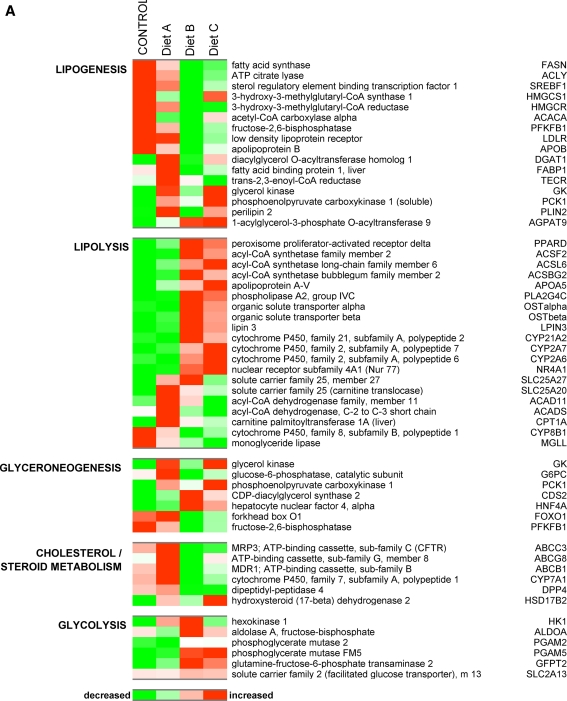
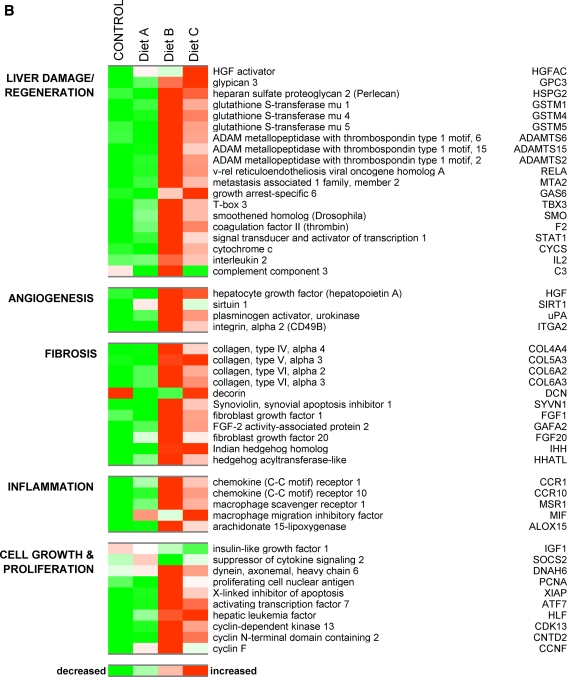
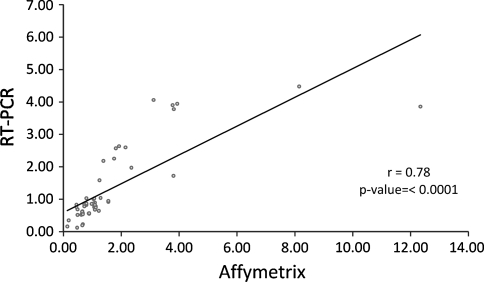
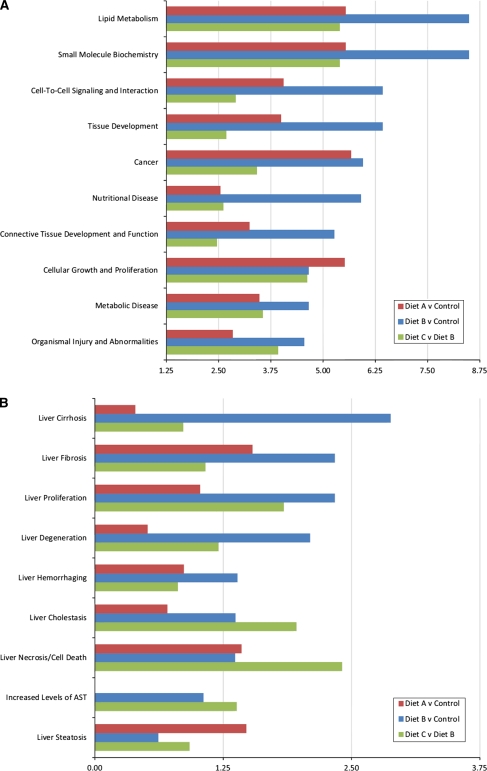
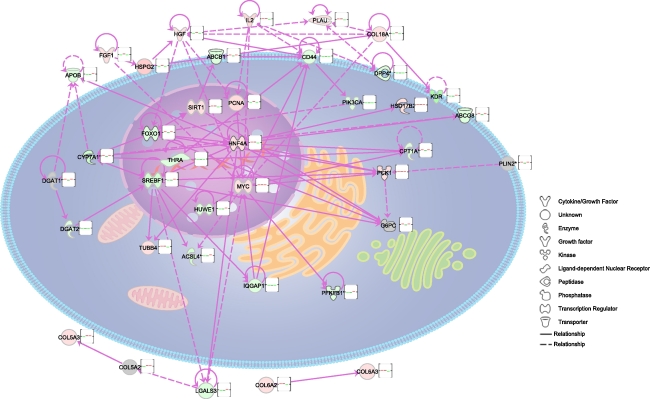
Nonalcoholic fatty liver disease begins with a relatively benign hepatic steatosis, often associated with increased adiposity, but may progress to a more severe nonalcoholic steatohepatitis with inflammation. A subset of these patients develops progressive fibrosis and ultimately cirrhosis. Various dietary components have been shown to contribute to the development of liver disease, including fat, sugars, and neonatal treatment with high doses of monosodium glutamate (MSG). However, rodent models of progressive disease have been disappointing, and alternative animal models of diet-induced liver disease would be desirable, particularly if they contribute to our knowledge of changes in gene expression as a result of dietary manipulation. The domestic cat has previously been shown to be an appropriate model for examining metabolic changes-associated human diseases such as diabetes. Our aim was therefore to compare changes in hepatic gene expression induced by dietary MSG, with that of a diet containing Trans-fat and high fructose corn syrup (HFCS), using a feline model. MSG treatment increased adiposity and promoted hepatic steatosis compared to control (P < 0.05). Exposure to Trans-fat and HFCS promoted hepatic fibrosis and markers of liver dysfunction. Affymetrix microarray analysis of hepatic gene expression showed that dietary MSG promoted the expression of genes involved in cholesterol and steroid metabolism. Conversely, Trans-fat and HFCS feeding promoted the expression of genes involved in lipolysis, glycolysis, liver damage/regeneration, and fibrosis. Our feline model examining gene-diet interactions (nutrigenomics) demonstrates how dietary MSG, Trans-fat, and HFCS may contribute to the development of hepatic steatosis.
Figures
Similar articles
-
Effect of dietary monosodium glutamate on HFCS-induced hepatic steatosis: expression profiles in the liver and visceral fat.Obesity (Silver Spring). 2010 Jun;18(6):1122-34. doi: 10.1038/oby.2009.502. Epub 2010 Jan 28. Obesity (Silver Spring). 2010. PMID: 20111022
-
Effect of dietary monosodium glutamate on trans fat-induced nonalcoholic fatty liver disease.J Lipid Res. 2009 Aug;50(8):1521-37. doi: 10.1194/jlr.M800418-JLR200. Epub 2008 Nov 11. J Lipid Res. 2009. PMID: 19001666 Free PMC article.
-
Prediabetic changes in gene expression induced by aspartame and monosodium glutamate in Trans fat-fed C57Bl/6 J mice.Nutr Metab (Lond). 2013 Jun 19;10:44. doi: 10.1186/1743-7075-10-44. eCollection 2013. Nutr Metab (Lond). 2013. PMID: 23783067 Free PMC article.
-
Dietary approach in the treatment of nonalcoholic fatty liver disease.World J Hepatol. 2015 Oct 28;7(24):2522-34. doi: 10.4254/wjh.v7.i24.2522. World J Hepatol. 2015. PMID: 26523205 Free PMC article. Review.
-
Carbohydrate intake and nonalcoholic fatty liver disease: fructose as a weapon of mass destruction.Hepatobiliary Surg Nutr. 2015 Apr;4(2):109-16. doi: 10.3978/j.issn.2304-3881.2014.11.05. Hepatobiliary Surg Nutr. 2015. PMID: 26005677 Free PMC article. Review.
Cited by
-
Dietary sugars: their detection by the gut-brain axis and their peripheral and central effects in health and diseases.Eur J Nutr. 2015 Feb;54(1):1-24. doi: 10.1007/s00394-014-0776-y. Epub 2014 Oct 9. Eur J Nutr. 2015. PMID: 25296886 Free PMC article. Review.
-
Concise Review: Organoids Are a Powerful Tool for the Study of Liver Disease and Personalized Treatment Design in Humans and Animals.Stem Cells Transl Med. 2016 Mar;5(3):325-30. doi: 10.5966/sctm.2015-0152. Epub 2016 Jan 21. Stem Cells Transl Med. 2016. PMID: 26798060 Free PMC article. Review.
-
A review of the alleged health hazards of monosodium glutamate.Compr Rev Food Sci Food Saf. 2019 Jul;18(4):1111-1134. doi: 10.1111/1541-4337.12448. Epub 2019 May 8. Compr Rev Food Sci Food Saf. 2019. PMID: 31920467 Free PMC article.
References
-
- Abdelmalek MF, Suzuk A, Guy C, Unalp-Arida A, Colvin R, Johnson RJ, Diehl AM. Nonalcoholic steatohepatitis clinical research network. Increased fructose consumption is associated with fibrosis severity in patients with nonalcoholic fatty liver disease. Hepatology. 2010;51(6):1961–1971. doi: 10.1002/hep.23535. - DOI - PMC - PubMed
LinkOut - more resources
Full Text Sources
Miscellaneous
