. 2012 Feb 9;119(6):1450-8.
doi: 10.1182/blood-2011-04-346676. Epub 2011 Dec 5.

KLF9 is a novel transcriptional regulator of bortezomib- and LBH589-induced apoptosis in multiple myeloma cells

Affiliations

KLF9 is a novel transcriptional regulator of bortezomib- and LBH589-induced apoptosis in multiple myeloma cells

Sudha Mannava et al. Blood. .

Abstract

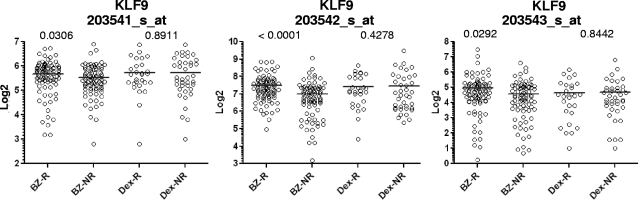
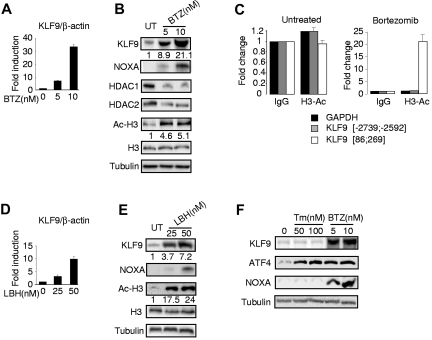
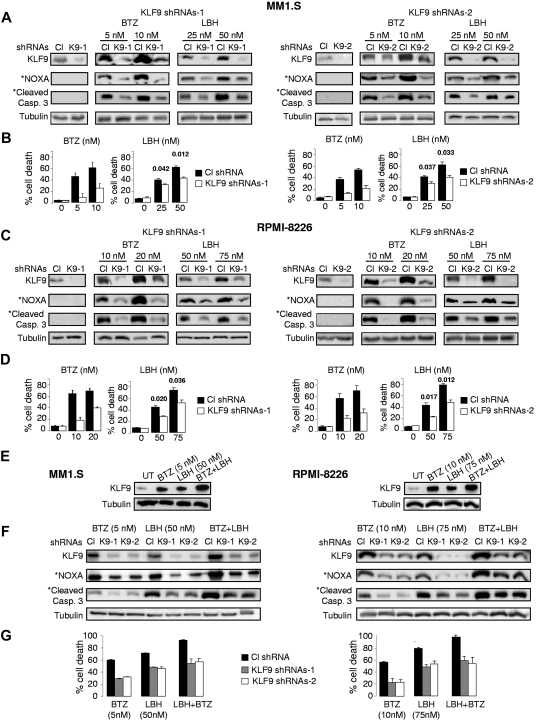
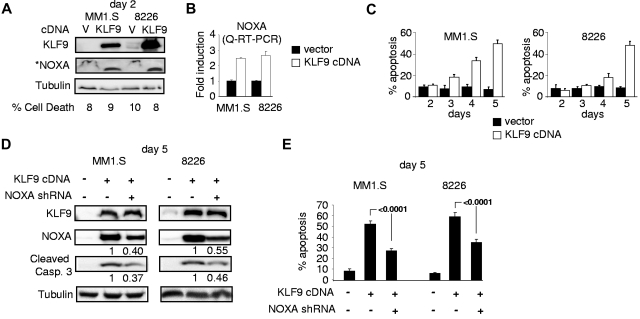
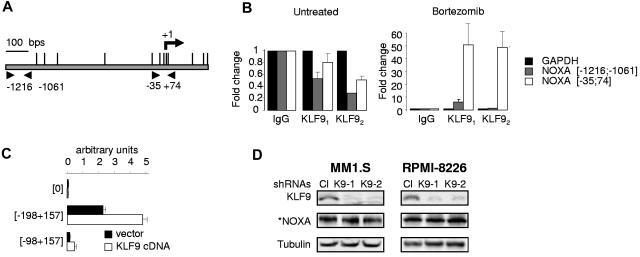
Bortezomib, a therapeutic agent for multiple myeloma (MM) and mantle cell lymphoma, suppresses proteosomal degradation leading to substantial changes in cellular transcriptional programs and ultimately resulting in apoptosis. Transcriptional regulators required for bortezomib-induced apoptosis in MM cells are largely unknown. Using gene expression profiling, we identified 36 transcription factors that displayed altered expression in MM cells treated with bortezomib. Analysis of a publically available database identified Kruppel-like family factor 9 (KLF9) as the only transcription factor with significantly higher basal expression in MM cells from patients who responded to bortezomib compared with nonresponders. We demonstrated that KLF9 in cultured MM cells was up-regulated by bortezomib; however, it was not through the induction of endoplasmic reticulum stress. Instead, KLF9 levels correlated with bortezomib-dependent inhibition of histone deacetylases (HDAC) and were increased by the HDAC inhibitor LBH589 (panobinostat). Furthermore, bortezomib induced binding of endogenous KLF9 to the promoter of the proapoptotic gene NOXA. Importantly, KLF9 knockdown impaired NOXA up-regulation and apoptosis caused by bortezomib, LBH589, or a combination of theses drugs, whereas KLF9 overexpression induced apoptosis that was partially NOXA-dependent. Our data identify KLF9 as a novel and potentially clinically relevant transcriptional regulator of drug-induced apoptosis in MM cells.


Figures

Figure 1
Figure 1
Microarray values for KLF9 expression in MM patients correlate with patient response to bortezomib, but not dexamethasone. Expression of KLF9 in patient myeloma cells was determined from gene expression profile arrays that were generated at Millenium Pharmaceuticals from patients before Bortezomib (Bz; n = 163) or dexamethasone therapy (Dex; n = 67), and deposited in the Gene expression omnibus database (GSE9782). Using the dataset annotations, KLF9 expression among responders (R) or nonresponders (NR) within Bz (n = 85 for R, n = 78 for NR) or Dex (n = 28 for R, n = 39 for NR) groups were plotted on the horizontal axis against the log transformed normalized affymetrix expression units on the vertical axis. Probe set numbers correspond to those in supplemental Table 2. P values between R and NR are shown above the corresponding therapy group.
Figure 2
Figure 2
Bortezomib and LBH589 up-regulate KLF9 in MM1.S cells. (A) KLF9/ACTB Q-RT-PCR signal ratios were obtained from total cellular RNAs corresponding to each group of MM1.S cells treated with indicated amounts of bortezomib (BTZ) for 24 hours. Signal ratios were normalized by the corresponding ratio in untreated cells (0nM). (B) MM1.S cells were treated with indicated amounts of bortezomib for 24 hours followed by Western blotting of total protein extracts with antibodies indicated on the left. Numbers below the panels show the fold increase of KLF9/tubulin and acetylated histone H3 (Ac-H3)/tubulin ratios normalized to that in the first lane (untreated cells). (C) MM1.S cells treated or not with 5nM of bortezomib for 24 hours were cross-linked, sonicated and subjected to chromatin immunoprecipitation with acetylated histone H3 (Ac-H3)–specific antibodies or nonspecific (IgG) antibodies followed by the reversal of the cross-linking and DNA isolation. Isolated DNA was used in quantitative PCR with GAPDH or KLF9 promoter-specific primers, positions of which are designated by the numbers. All PCR signals were normalized by GAPDH-specific PCR signals and by the corresponding PCR signals obtained in reactions on DNA precipitated with IgG antibodies. (D) KLF9/ACTB Q-RT-PCR signal ratios were obtained from total cellular RNAs corresponding to each group of MM1.S cells treated with indicated amounts of LBH589 (LBH) for 24 hours. Signal ratios were normalized by the corresponding ratio in untreated cells (0nM). (E) MM1.S cells were treated with the indicated amounts of LBH589 (LBH) for 24 hours followed by Western blotting of total protein extracts with antibodies indicated on the left. Numbers below the panels show the fold increase of KLF9/tubulin and acetylated histone H3 (Ac-H3)/tubulin ratios normalized to that in the first lane (untreated cells). (F) MM1.S cells were treated with the indicated amounts of tunicamycin (TM) or bortezomib (BTZ) for 24 hours followed by cell collection and Western blotting of cell total protein extracts with antibodies indicated on the left.
Figure 3
Figure 3
KLF9 knockdown suppresses apoptosis and efficient up-regulation of NOXA by bortezomib or LBH589. (A) MM1.S cells were infected with control shRNAs (CL), KLF9 shRNAs 1 (K9-1), or KLF9 shRNAs2 (K9-2). Forty-eight hours after infection, cells were incubated with the vehicle (DMSO) or with the indicated amounts of bortezomib (BTZ) or LBH589 (LBH) for 48 hours. Total protein extracts from the cells were probed by Western blotting with antibodies designated on the left. *Endogenous NOXA and cleaved caspase 3 levels in untreated cells were not detected under the exposure conditions used to detect these proteins in cells treated with the drugs. (B) Cells described in panel A were stained with the trypan blue. The percentage of dead cells was determined by counting positive and negative cells under light microscope in multiple view fields. The 2-tailed P value is shown for the groups with close values of the means. (C) RPMI-8226 cells were infected with control shRNAs (CL) or KLF9 shRNAs 1 (K9-1) or KLF9 shRNAs2 (K9-2). Forty-eight hours after infection, cells were incubated with the vehicle (DMSO) or with the indicated amounts of bortezomib (BTZ) or LBH589 (LBH) for 48 hours. Total protein extracts from the cells were probed in Western blotting with antibodies designated on the left. *Endogenous NOXA and cleaved caspase 3 levels in untreated cells were not detected under the exposure conditions used to detect these proteins in cells treated with the drugs. (D) Cells described in panel C were stained with trypan blue. The percentage of dead cells was determined by counting positive and negative cells under light microscope in multiple view fields. The two-tailed P value is shown for the groups with close values of the means. (E) Cells were incubated with no drug (UT) or with the indicated amounts of bortezomib (BTZ), LBH589 (LBH), or combination of the same concentration of both drugs for 24 hours. After incubation, cells were collected and total protein extracts from the cells were probed in Western blotting with antibodies designated on the left. (F) Cells were infected with control shRNAs (CL) KLF9 shRNAs 1 (K9-1), or KLF9 shRNAs2 (K9-2). Forty-eight hours after infection, cells were incubated with the indicated amounts of bortezomib (BTZ), LBH589 (LBH), or combination of the same concentration of both drugs. After incubation, cells were collected and total protein extracts from the cells were probed in Western blotting with antibodies designated on the left. (G) Cells described in panel F were stained with trypan blue. The percentage of dead cells was determined by counting positive and negative cells under light microscope in multiple view fields.
Figure 4
Figure 4
KLF9 induces NOXA-dependent apoptosis. (A) MM1.S and RPMI-8226 cells were infected with control vector (V) or vector expressing KLF9 cDNA (KLF9). Cells were collected 48 hours after infection and the total protein extracts were probed in Western blotting with antibodies shown on the left. *Note that an enhanced assay was used for detecting basal levels of NOXA (see “Immunoblotting”). The percentage of dead cells was determined by counting trypan blue positive and negative cells in multiple view fields. (B) NOXA/ACTB Q-RT-PCR signal ratios were obtained in indicated cells expressing KLF9 cDNA or empty vector. Signal ratios were normalized by the corresponding ratio in cells infected with the empty vector. (C) Cells were infected as described in (A). At the indicated days after infection, cells were stained for the activated caspase 3 using APO LOGIX “Carboxyfluorescein FAM-DEVD-FMK for caspase 3” kit. The percentage of apoptotic cells was determined by counting positive and negative cells with fluorescence microscopy in multiple view fields. (D) MM1.S and RPMI-8826 cells were infected with NOXA shRNA followed by super-infection with control vector or vector expressing KLF9 cDNA. Five days after the second infection cells were collected and total cellular protein extracts were probed in Western blotting with the antibodies designated on the left. (E) Cells described in panel D were stained for the activated caspase 3 using APO LOGIX “Carboxyfluorescein FAM-DEVD-FMK for caspase 3” kit. The percentage of apoptotic cells was determined by counting positive and negative cells with fluorescence microscopy in multiple view fields. The 2-tailed P value is shown.
Figure 5
Figure 5
KLF9 directly interacts with NOXA promoter in bortezomib-dependent manner. (A) Schematic representation of human NOXA promoter. Vertical lines above the central bar indicate potential KLF9 binding sites. Arrowheads correspond to the position of primers used for Q-PCR. The transcription start site (+1) is shown by the arrow. (B) MM1.S cells untreated or treated with 5nM bortezomib for 24 hours were cross-linked, lysed, and chromatin was immunoprecipitated with 2 different KLF9-specific antibodies (KLF91 or KLF92) or nonspecific (IgG) antibodies followed by the reversal of the cross-linking and DNA isolation. DNA was used in quantitative PCR with GAPDH or NOXA promoter-specific primers positions of which are designated by the numbers. All PCR signals were normalized by GAPDH-specific PCR signals and by the corresponding PCR signals obtained in reactions on DNA precipitated with IgG antibodies. (C) Control pGL3-basic vector “[0]” or vectors containing indicated regions of NOXA promoter were mixed with pRL-SV40 plasmid, expressing renilla luciferase gene in 1÷10 proportion, followed by transfection into HEK293 cells along with vector expressing KLF9 cDNA or empty vector. Forty-eight hours after transfection, cells were collected, and firefly and renilla-dependent luciferase activities were determined using the dual-luciferase assay kit (Promega). Measurements of firefly-dependent luciferase activity were normalized with respect to renilla signals. (D) Cells were infected with control (Cl) or KLF9-specific shRNAs (K9-1 or K9-2). Cells were collected 48 hours after infection and the total protein extracts were probed in Western blotting with antibodies shown on the left. *Note that an enhanced assay was used for detecting basal levels of NOXA (see“Immunoblotting”).

Similar articles

Cited by

References

    1. Anderson KC. Bortezomib therapy for myeloma. Curr Hematol Rep. 2004;3(1):65. - PubMed
    1. Greenlee RT, Murray T, Bolden S, Wingo PA. Cancer statistics, 2000. CA Cancer J Clin. 2000;50(1):7–33. - PubMed
    1. Kumar SK, Rajkumar SV, Dispenzieri A, et al. Improved survival in multiple myeloma and the impact of novel therapies. Blood. 2008;111(5):2516–2520. - PMC - PubMed
    1. Raab MS, Podar K, Breitkreutz I, et al. Multiple myeloma. Lancet. 2009;374(9686):324–339. - PubMed
    1. Venner CP, Connors JM, Sutherland HJ, et al. Novel agents improve survival of transplant patients with multiple myeloma including those with high-risk disease defined by early relapse (< 12 months). Leuk Lymphoma. 2011;52(1):34–41. - PubMed

Publication types

MeSH terms