

Individual-scale inference to anticipate climate-change vulnerability of biodiversity
- PMID: 22144386
- PMCID: PMC3223806
- DOI: 10.1098/rstb.2011.0183
Individual-scale inference to anticipate climate-change vulnerability of biodiversity
Abstract
Anticipating how biodiversity will respond to climate change is challenged by the fact that climate variables affect individuals in competition with others, but interest lies at the scale of species and landscapes. By omitting the individual scale, models cannot accommodate the processes that determine future biodiversity. We demonstrate how individual-scale inference can be applied to the problem of anticipating vulnerability of species to climate. The approach places climate vulnerability in the context of competition for light and soil moisture. Sensitivities to climate and competition interactions aggregated from the individual tree scale provide estimates of which species are vulnerable to which variables in different habitats. Vulnerability is explored in terms of specific demographic responses (growth, fecundity and survival) and in terms of the synthetic response (the combination of demographic rates), termed climate tracking. These indices quantify risks for individuals in the context of their competitive environments. However, by aggregating in specific ways (over individuals, years, and other input variables), we provide ways to summarize and rank species in terms of their risks from climate change.
Figures
 , i.e. they summarize the population.
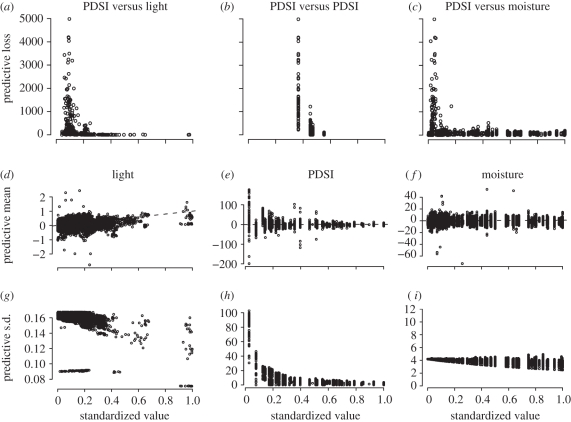
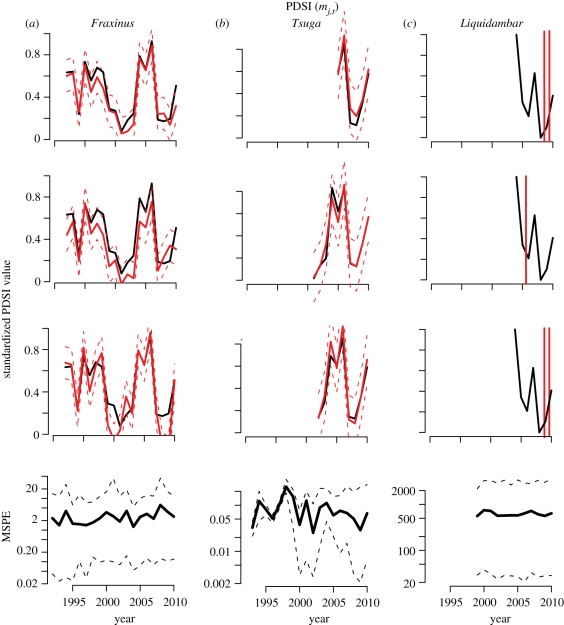
 and (g–i) standard deviations
  plotted against actual inputs xij,t(q) for all Fraxinus tree-years. The 1 : 1 line for predictive means indicates agreement.
References
-
- Parmesan C., Yoh G. 2003. A globally coherent fingerprint of climate change impacts across natural systems. Nature 421, 37–4210.1038/nature01286 (doi:10.1038/nature01286) - DOI - DOI - PubMed
-
- Karl T. R., Melillo J. M., Peterson T. C. (eds) 2009. Global climate change impacts in the United States. New York, NY: Cambridge University Press
-
- Field C. B., Mortsch L. D., Brklacich M., Forbes D. L., Kovacs P., Patz J. A., Running S. W., Scott M. J. 2007. North America. In Climate change 2007: impacts, adaptation and vulnerability. Contribution of Working Group II to the Fourth Assessment Report of the Intergovernmental Panel on Climate Change (eds Parry M. L., Canziani O. F., Palutikof J. P., van der Linden P. J., Hanson C. E.), pp. 617–652 Cambridge, UK: Cambridge University Press
-
- Körner C. 2000. Biosphere responses to CO2 enrichment. Ecol. Appl. 10, 1590–1619
-
- Rustad L. E., Campbel J. L., Marion G. M., Norby R. J., Mitchell M. J., Hartley A. E., Cornelissen J. H. C., Gurevitch J. 2001. A meta-analysis of the response of soil respiration, net nitrogen mineralization, and aboveground plant growth to experimental ecosystem warming. Oecologia 126, 543–56210.1007/s004420000544 (doi:10.1007/s004420000544) - DOI - DOI - PubMed
Publication types
MeSH terms
LinkOut - more resources
Full Text Sources
Medical
