. 2012 Feb;32(3):633-51.
doi: 10.1128/MCB.06212-11. Epub 2011 Dec 5.

MicroRNA-200c represses migration and invasion of breast cancer cells by targeting actin-regulatory proteins FHOD1 and PPM1F

Affiliations

MicroRNA-200c represses migration and invasion of breast cancer cells by targeting actin-regulatory proteins FHOD1 and PPM1F

Sarah Jurmeister et al. Mol Cell Biol. 2012 Feb.

Abstract

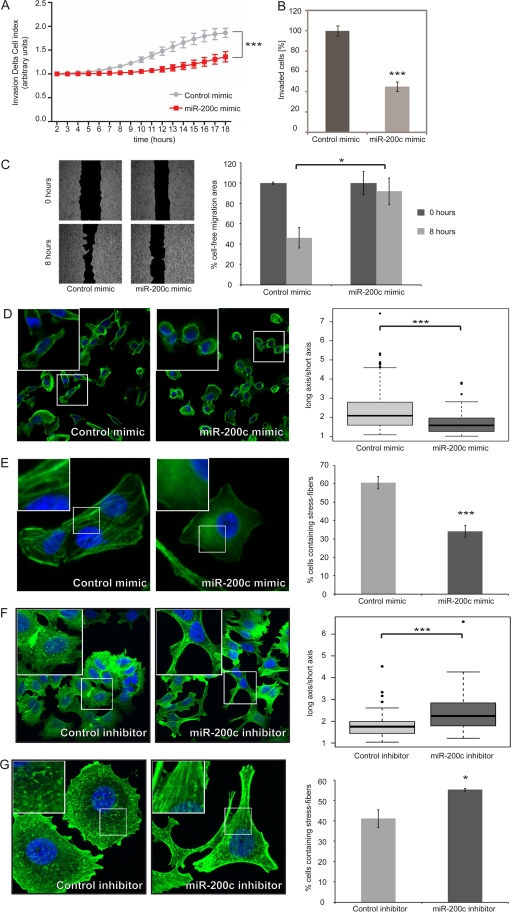
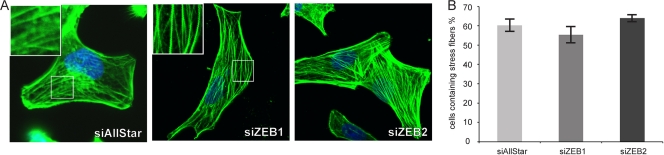
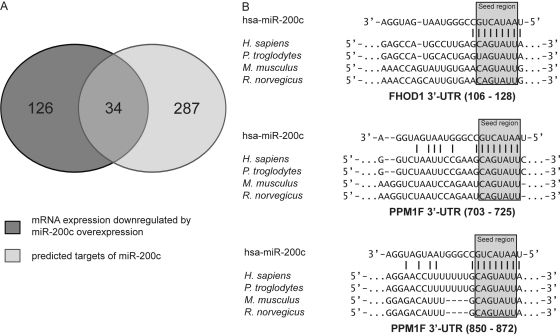
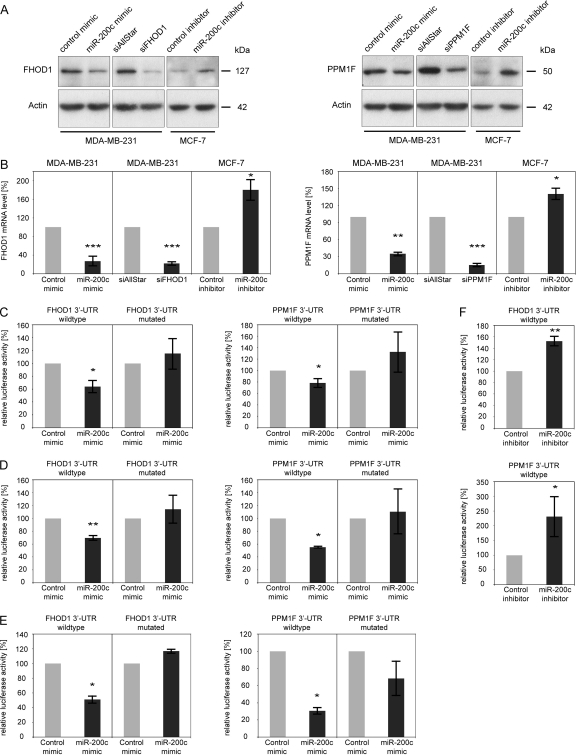
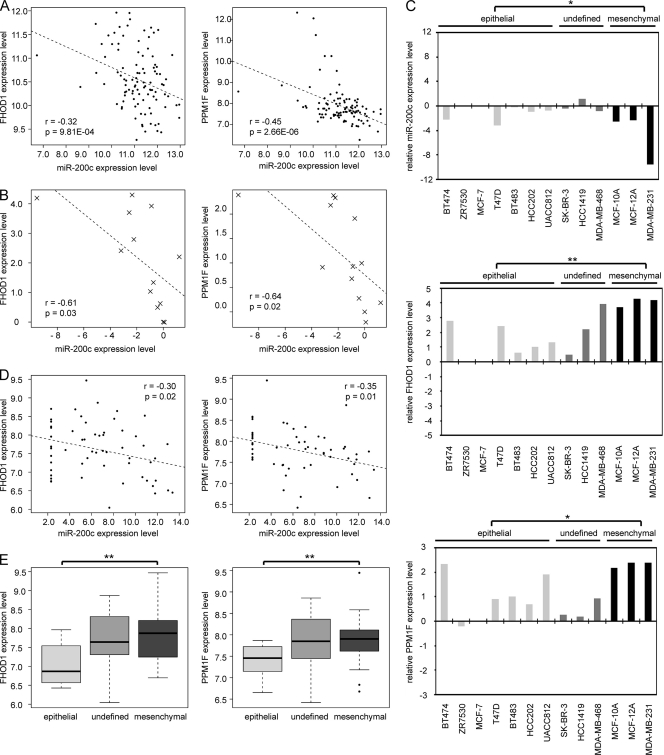
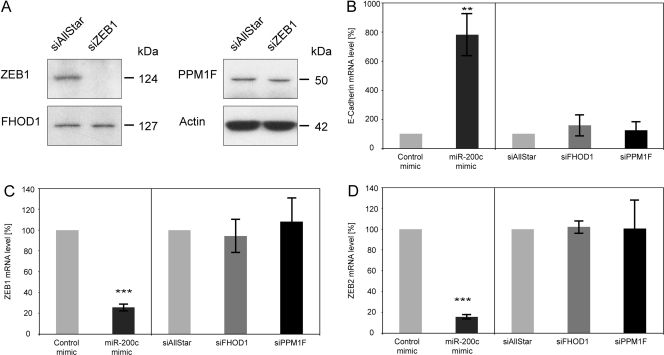
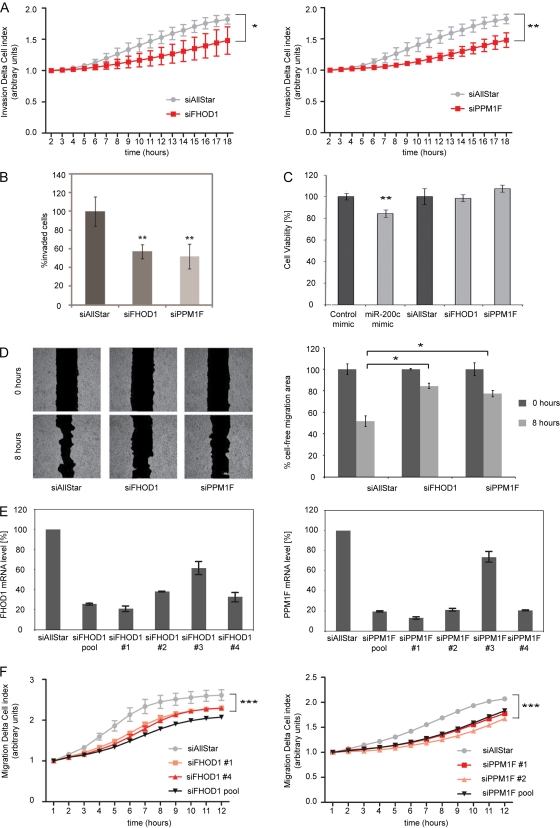
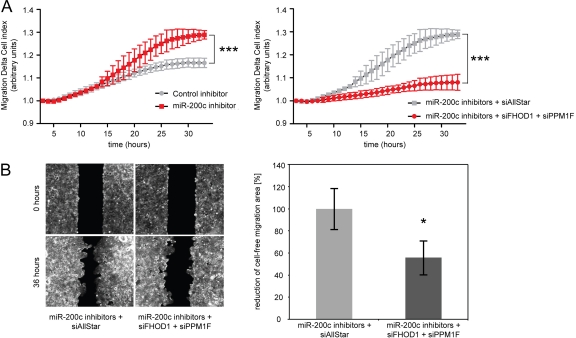
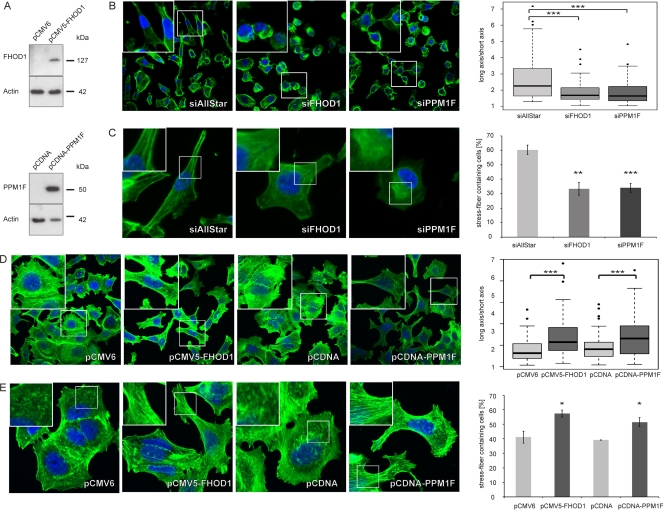
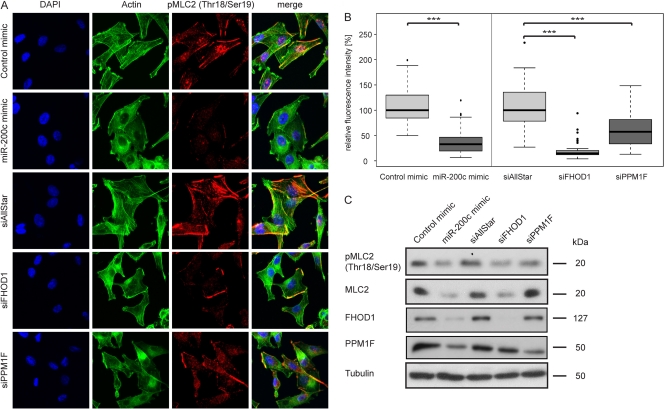
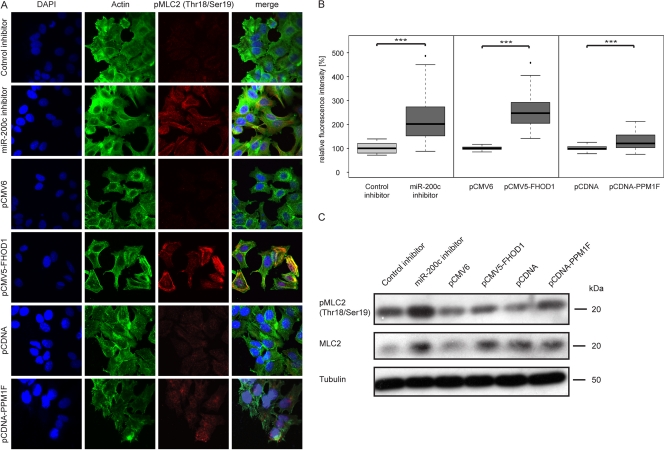
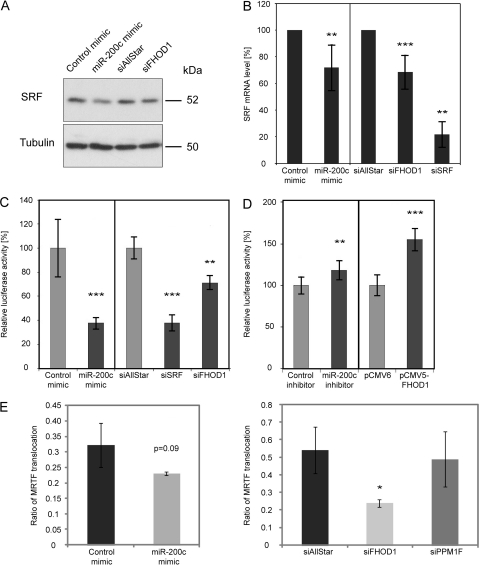
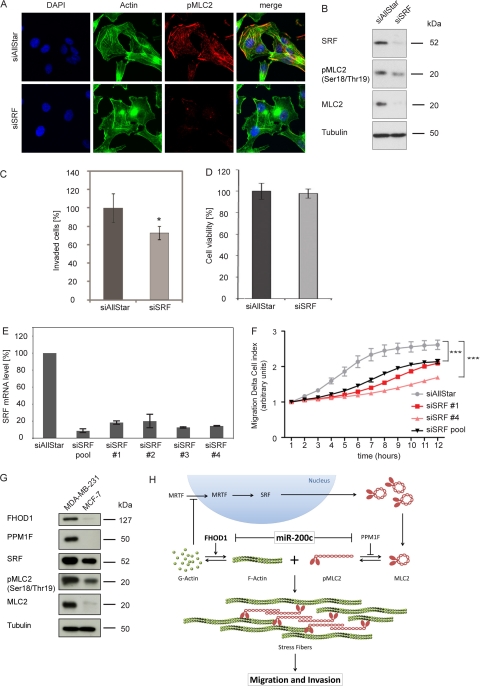
MicroRNA-200c (miR-200c) has been shown to suppress epithelial-mesenchymal transition (EMT), which is attributed mainly to targeting of ZEB1/ZEB2, repressors of the cell-cell contact protein E-cadherin. Here we demonstrated that modulation of miR-200c in breast cancer cells regulates cell migration, cell elongation, and transforming growth factor β (TGF-β)-induced stress fiber formation by impacting the reorganization of cytoskeleton that is independent of the ZEB/E-cadherin axis. We identified FHOD1 and PPM1F, direct regulators of the actin cytoskeleton, as novel targets of miR-200c. Remarkably, expression levels of FHOD1 and PPM1F were inversely correlated with the level of miR-200c in breast cancer cell lines, breast cancer patient samples, and 58 cancer cell lines of various origins. Furthermore, individual knockdown/overexpression of these target genes phenocopied the effects of miR-200c overexpression/inhibition on cell elongation, stress fiber formation, migration, and invasion. Mechanistically, targeting of FHOD1 by miR-200c resulted in decreased expression and transcriptional activity of serum response factor (SRF), mediated by interference with the translocation of the SRF coactivator mycocardin-related transcription factor A (MRTF-A). This finally led to downregulation of the expression and phosphorylation of the SRF target myosin light chain 2 (MLC2) gene, required for stress fiber formation and contractility. Thus, miR-200c impacts on metastasis by regulating several EMT-related processes, including a novel mechanism involving the direct targeting of actin-regulatory proteins.


Figures

Fig 1
Fig 1
miR-200c regulates invasion, migration, elongation, and stress fiber formation in breast cancer cells. (A) An RTCA (real-time cell analyzer) invasion assay of MDA-MB-231 cells transfected with microRNA mimics. MDA-MB-231 cells were transfected, starved in serum-free medium for 24 h, and seeded in RTCA CIM-16 plates covered with Matrigel. Cells were stimulated to invade in the presence of TGF-β (10 ng/ml), and impedance measurements were performed in a time-resolved manner. Means for four replicates ± standard deviations are shown; a t test was performed for the last time point. (B) Matrigel invasion assay of MDA-MB-231 cells transfected with microRNA mimics. Cells were transfected, seeded in Matrigel-coated invasion plates, and stimulated to invade in the presence of TGF-β (10 ng/ml). Invaded cells were quantified by flow cytometry. (C) Wound-healing assay of MDA-MB-231 cells transfected with microRNA mimics. MDA-MB-231 cells were seeded in migration chambers and transfected with 25 nM control or miR-200c mimic. Images of the migration area were captured 0 h and 8 h after removal of the migration chamber. For migration area quantification, the cell-free area of pictures was defined manually and filled with black for a subsequent gray-black selection process performed by the CellProfiler software program (n = 2). (D) Analysis of cell elongation by fluorescence microscopy in MDA-MB-231 cells. Cells were transfected with control mimic or miR-200c mimic and fixed 24 h after transfection. Actin filaments were visualized by staining with Alexa Fluor 488-phalloidin (green), and cell nuclei were stained with DAPI (blue). Boxes in the upper left corners of the images illustrate cell morphology with higher resolution. Cell elongation was quantified by measuring the long and short axes of cells using the Zeiss LSM Image Examiner software. Box plots represent data from two independent experiments, with 40 cells measured for each condition. (E) TGF-β-induced stress fiber assay in MDA-MB-231 cells. Cells were transfected with control mimic or miR-200c mimic and starved for 24 h. Stress fibers were induced by treatment with TGF-β for 5 h, and cells were stained with Alexa Fluor 488-phalloidin and DAPI. Boxes in the upper left corners of the images demonstrate stress fibers with higher resolution. The percentage of stress fiber-containing cells was determined by counting 200 to 300 cells per experiment; data shown represent means for three independent experiments. (F) Analysis of cell elongation by fluorescence microscopy in MCF-7 cells. Cells were transfected with control microRNA hairpin inhibitor or miR-200c hairpin inhibitor, starved for 24 h starting 2 days after transfection, and stimulated with TGF-β for 5 h. Staining, microscopy, and image analysis were carried out as for panel D. (G) Stress fiber assay in MCF-7 cells. Cells were transfected with control microRNA hairpin inhibitor or miR-200c hairpin inhibitor and starved for 24 h starting 2 days after transfection. Stress fibers were induced by treatment with TGF-β for 5 h. Staining, microscopy, and image analysis were carried out as described for panel E.
Fig 2
Fig 2
Silencing of ZEB1 or ZEB2 does not interfere with stress fiber formation. (A) MDA-MB-231 cells were transfected with control siRNA (siAllStar) or siRNA directed against ZEB1 or ZEB2 and starved for 24 h. Stress fibers were induced by treatment with TGF-β for 5 h, and cells were stained for actin with Alexa Fluor 488-phalloidin (green), with the nucleus stained with DAPI (blue). (B) The percentage of stress fiber-containing cells was determined by counting 200 to 300 cells per experiment; data shown represents means of data from two independent experiments.
Fig 3
Fig 3
Identification of potential miR-200c target genes. (A) mRNA expression profiling of MDA-MB-231 cells transfected with miR-200c mimic was performed using the Illumina HumanWG-6 v3.0 expression array chip (43). miR-200c targets were predicted using the TargetScan release 5.1 and PITA target prediction programs, and the lists of downregulated genes and predicted targets were merged, resulting in 34 genes as candidates for direct targeting by miR-200c. (B) miR-200c target sites in the 3′-UTRs of FHOD1 and PPM1F and interspecies conservation of seed matching sequences (gray box).
Fig 4
Fig 4
Validation of FHOD1 and PPM1F as direct targets of miR-200c. (A) MDA-MB-231 cells were transfected with microRNA mimics or siRNAs, and total protein was isolated after 24 h. MCF-7 cells were transfected for 48 h with microRNA hairpin inhibitors prior to protein isolation. FHOD1 and PPM1F were detected by Western blotting; β-actin was used as a loading control. (B) MDA-MB-231 cells were transfected with microRNA mimics or siRNAs for 24 h, and MCF-7 cells were transfected with microRNA hairpin inhibitors for 48 h. RNA was isolated, and FHOD1 and PPM1F transcript levels were quantified by qRT-PCR. ACTB and HPRT were used as housekeeping-gene controls. (C) MDA-MB-231 cells were cotransfected with microRNA mimics and psiCHECK-2 expression constructs containing the 3′-UTR of FHOD1 (n = 3) or PPM1F (n = 4) downstream of the Renilla luciferase gene. Forty-eight hours after transfection, luciferase activity was measured. Renilla luciferase activity was normalized first to firefly luciferase activity and then to the values measured for the parental vector psiCHECK-2. In the mutated constructs, the miR-200c target sites were disrupted by site-directed mutagenesis of four nucleotides within the seed sequence. (D) Luciferase assay with MCF-7 cells was carried out in the same manner as with MDA-MB-231 cells (n = 3 for FHOD1 3′-UTR; n = 2 for PPM1F 3′-UTR). (E) Luciferase assay with HEK-293FT cells was carried out in the same manner as with MDA-MB-231 cells (n = 2 for FHOD1 3′-UTR and PPM1F 3′-UTR). (F) MCF-7 cells were cotransfected with luciferase reporter constructs as before (n = 3 for FHOD1 3′UTR and PPM1F 3′-UTR) and microRNA hairpin inhibitors. Forty-eight hours after transfection, luciferase activity was measured.
Fig 5
Fig 5
Expression correlation of FHOD1 and PPM1F with miR-200c and with epithelial-mesenchymal states of the cells. (A) mRNA and microRNA profiling data for 101 breast cancer specimens was obtained from the NCBI GEO database (GEO accession no. GSE19783); expression levels were provided as log2-transformed, normalized data sets. Pearson correlation coefficients (r) and P values (two-tailed) were computed. Dashed lines indicate a first-order linear model fitting the data. (B) Transcript levels of miR-200c, FHOD1, and PPM1F in 13 breast cancer and mammary epithelial cell lines were quantified by qRT-PCR. Expression levels were normalized to data for MCF-7 cells and log2 transformed. Pearson correlation coefficients and P values were computed. (C) Breast cancer cell lines were divided into epithelial, undefined, and mesenchymal phenotypes based on published data (2, 24, 29, 37), and expression levels from panel B were compared between the groups. (D) Data sets for the expression of miR-200c, FHOD1, and PPM1F in the NCI60 panel of cancer cell lines were obtained from http://dtp.nci.nih.gov/index.html (experiment IDs 372534, 124184, and 27785). Data were log2 transformed, and Pearson correlation coefficients and P values were computed. (E) NCI60 cell lines were classified as epithelial, undefined, and mesenchymal according to reference . Expression levels of FHOD1 and PPM1F were compared between the groups using the data from panel D.
Fig 6
Fig 6
Effects of FHOD1 and PPM1F on the actin cytoskeleton are independent of the ZEB/E-cadherin axis. (A) MDA-MB-231 cells were transfected with control siRNA (siAllStar) or siRNA directed against ZEB1. Forty-eight hours after transfection, protein was isolated and expression levels of ZEB1, FHOD1, and PPM1F were assessed by Western blotting. β-Actin was used as a loading control. (B to D) MDA-MB-231 cells were transfected for 24 h with microRNA mimics or siRNAs. RNA was isolated, and E-cadherin, ZEB1, and ZEB2 transcript levels were quantified by qRT-PCR. ACTB and HPRT were used as housekeeping-gene controls.
Fig 7
Fig 7
Individual silencing of FHOD1 or PPM1F phenocopies the effect of miR-200c on invasion and migration. (A) RTCA invasion assay of MDA-MB-231 cells transfected with siRNAs. MDA-MB-231 cells were transfected, starved in serum-free medium for 24 h, and seeded in RTCA CIM-16 plates covered with Matrigel. Cells were allowed to invade in the presence of TGF-β (10 ng/ml), and impedance measurements were performed in a time-resolved manner. Mean for four replicates ± standard deviations are shown; a t test was performed for the last time point. (B) Matrigel invasion assay of MDA-MB-231 cells transfected with microRNA mimics. Cells were transfected, seeded in Matrigel-coated invasion plates, and stimulated to invade in the presence of TGF-β (10 ng/ml). Invaded cells were quantified by flow cytometry. (C) Viability assay of MDA-MB-231 cells. Cells were transfected with microRNA mimics or with siRNAs. Cell viability was measured using the Cell Titer Glo assay 72 h posttransfection. Viability values are normalized to control mimic for miR-200c and to siAllStar for siRNAs. (D) Wound-healing assay of MDA-MB-231 cells transfected with siRNAs. MDA-MB-231 cells were seeded in migration chambers and transfected with 40 nM siRNA. Images of the migration area were captured 0 h and 8 h after removal of the migration chamber. Migration area quantification was done as for Fig. 1C. (E) Effect of individual siRNAs on FHOD1 and PPM1F transcript levels. MDA-MB-231 cells were transfected with 40 nM either individual siRNAs or a pool of 4 siRNAs directed against FHOD1 or PPM1F. After 48 h, RNA was isolated, and FHOD1 and PPM1F transcript levels were quantified by qRT-PCR. ACTB and HPRT were used as housekeeping-gene controls. (F) RTCA migration assay of MDA-MB-231 cells transfected with siRNAs. MDA-MB-231 cells were transfected, starved in serum-free medium for 24 h, and seeded in RTCA CIM-16 plates. Full medium was used as a chemoattractant, and impedance measurements were performed in a time-resolved manner.
Fig 8
Fig 8
Silencing of FHOD1 and PPM1F is sufficient to prevent the stimulatory effect of miR-200c inhibition on migration. (A) RTCA migration assay of MCF-7 cells transfected with miRNA inhibitors together with siRNAs. MCF-7 cells were transfected, starved in serum-free medium for 24 h, and seeded in RTCA CIM-16 plates. Full medium was used as a chemoattractant, and impedance measurements were performed in a time-resolved manner. Means for four replicates ± standard deviations are shown; a t test was performed for the last time point. (B) Wound-healing assay of MCF-7 cells transfected with microRNA inhibitors and siRNAs. MCF-7 cells were seeded in migration chambers and transfected with microRNA inhibitors and siRNAs. Images of the migration area were captured 0 h and 36 h after removal of the migration chamber. For migration area quantification, the cell-free areas of the pictures were defined manually and filled with black for the subsequent gray-black selection process performed by CellProfiler software (n = 5 to 8).
Fig 9
Fig 9
FHOD1 and PPM1F regulate elongation and stress fiber formation of breast cancer cells. (A) Validation of FHOD1 and PPM1F overexpression constructs. MCF-7 cells were transfected with expression constructs for the FHOD1 ORF (pCMV5-HA-FHOD1), PPM1F ORF (pcDNA-Dest47-PPM1F), and respective empty vector controls for 48 h. Protein was isolated, and FHOD1 as well as PPM1F expression levels were analyzed by Western blotting. β-Actin was used as a loading control. (B) Analysis of cell elongation by fluorescence microscopy in MDA-MB-231 cells. Cells were transfected with control siRNA (siAllStar) or siRNAs directed against FHOD1 and PPM1F and fixed 24 h after transfection. Actin filaments were visualized by staining with Alexa Fluor 488-phalloidin (green) and the nucleus by staining with DAPI (blue). Cell elongation was quantified by measuring the long and short axes of cells using the Zeiss LSM Image Examiner. Box plots represent data from two independent experiments, each time measuring 40 cells per condition. (C) Stress fiber assay of MDA-MB-231 cells. Cells were transfected with siRNAs and starved for 24 h. Stress fibers were induced by treatment with TGF-β for 5 h, and cells were stained with Alexa Fluor 488-phalloidin and DAPI. The percentage of stress fiber-containing cells was determined by counting 200 to 300 cells per experiment; data shown represents means of data from three independent experiments. (D) Analysis of cell elongation by fluorescence microscopy in MCF-7 cells. Cells were transfected with expression constructs for FHOD1 or PPM1F or respective empty vectors, starved for 24 h starting 2 days after transfection, and stimulated with TGF-β for 5 h. Staining, microscopy, and image analysis were carried out as described for panel B. (E) Stress fiber assay of MCF-7 cells. Cells were transfected with expression constructs for FHOD1 or PPM1F or respective empty vectors, starved for 24 h starting 2 days after transfection, and stimulated with TGF-β for 5 h for induction of stress fibers. Staining, microscopy, and image analysis were carried out as described for panel C.
Fig 10
Fig 10
Overexpression of miR-200c or silencing of its target genes reduces MLC2 phosphorylation. (A) MDA-MB-231 cells were transfected with microRNA mimics and siRNAs for 24 h and starved for an additional 24 h. Stress fibers were induced by treatment with TGF-β for 5 h, and cells were stained for actin with Alexa Fluor 488-phalloidin (green), for pThr18/pSer19-MLC2 (pMLC2; red), and for the nucleus with DAPI (blue). (B) Quantification of pMLC2 staining. Immunofluorescence images of MDA-MB-231 cells transfected with microRNA mimics and siRNAs were acquired as described for panel A. Mean fluorescence intensities of approximately 40 cells per condition were quantified using the ImageJ software program. For representation in box plots, data were normalized to the median of control mimic or siAllStar, respectively. (C) MDA-MB-231 cells were transfected, starved and stimulated as for panel A, and protein was isolated. pThr18/pSer19-MLC2 (pMLC2), total MLC2 (MLC2), FHOD1, and PPM1F were detected by Western blotting. Tubulin was used as a loading control.
Fig 11
Fig 11
Inhibition of miR-200c or overexpression of its target genes increases MLC2 phosphorylation. (A) MCF-7 cells were transfected with microRNA inhibitors or expression constructs for 24 h and starved for an additional 24 h. Stress fibers were induced by treatment with TGF-β for 5 h, and cells were stained for actin with Alexa Fluor 488-phalloidin (green), for pThr18/pSer19-MLC2 (pMLC2; red), and for the nucleus with DAPI (blue). (B) Quantification of pMLC2 staining. Immunofluorescence images of MCF-7 cells transfected with microRNA inhibitors or expression constructs were acquired as described for panel A. Mean fluorescence intensities of approximately 40 cells per condition were quantified using ImageJ. For representation in box plots, data were normalized to the median of control mimic or siAllStar, respectively. (C) MCF-7 cells were transfected, starved, and stimulated as for panel A, and protein was isolated. pThr18/pSer19-MLC2 (pMLC2) and total MLC2 (MLC2) were detected by Western blotting. Tubulin was used as a loading control.
Fig 12
Fig 12
miR-200c and its target gene FHOD1 regulate SRF. (A) MDA-MB-231 cells were transfected with microRNA mimics or siRNAs. Protein was isolated 48 h after transfection, and SRF protein levels were determined by Western blotting. Tubulin was used as a loading control. (B) MDA-MB-231 cells were transfected with microRNA mimics or siRNAs for 48 h. RNA was isolated, and SRF transcript levels were determined by qRT-PCR, using HPRT and TFRC as housekeeping genes; n = 5 except for siSRF (n = 3). (C) SRF response element reporter assay with microRNA mimics and siRNAs. HEK293FT cells were cotransfected with the pGL4.34 [luc2P/SRF-RE/Hygro] reporter vector, pRL-TK vector, and microRNA mimics or siRNAs. Twenty-four hours after transfection, cells were starved for 24 h and stimulated with 10 ng/ml TGF-β1 for 6 h before cell lysis. Luciferase activity was measured and normalized to Renilla luciferase activity (n = 8). (D) SRF response element reporter assay with microRNA hairpin inhibitors and expression constructs. HEK293FT cells were cotransfected with the pGL4.34 [luc2P/SRF-RE/Hygro] reporter vector, pRL-TK vector, and microRNA hairpin inhibitors or expression constructs. SRF transcriptional activity was analyzed as described for panel C (n = 8). (E) MRTF nuclear translocation assay. MDA-MB-231 cells were transfected with miRNA mimics or siRNAs and stained for MRTF-A and nuclei (DAPI). Images for quantitative analysis at magnification ×20 were acquired and analyzed by using Olympus ScanR analysis software. Cells with a ratio of nuclear/cytoplasmic localization of MRTF-A higher than 1 were considered positive for nuclear localization, while cells with a ratio of <1 were considered negative for nuclear localization. Data shown represent fold changes in the ratio of MRTF-A nuclear localization with standard deviations.
Fig 13
Fig 13
Regulation of MLC2 by miR-200c and FHOD1 is mediated through SRF. (A) MDA-MB-231 cells were transfected with control siRNA (siAllStar) or siRNA directed against SRF for 24 h. Cells were starved for an additional 24 h, and stress fibers were induced by stimulation with 10 ng/ml TGF-β for 5 h. Cells were stained for actin with Alexa Fluor 488-phalloidin (green), for pThr18/pSer19-MLC2 (pMLC2; red), and for the nucleus with DAPI (blue). (B) MDA-MB-231 cells were treated as for panel A, and protein was isolated. SRF, pMLC (Thr18/Ser19), and MLC were detected by Western blotting, using tubulin as a loading control. (C) Matrigel invasion assay of MDA-MB-231 cells transfected with siRNAs. Cells were transfected, seeded in Matrigel-coated invasion plates, and stimulated to invade in the presence of TGF-β (10 ng/ml). Invaded cells were quantified by flow cytometry. (D) Viability assay of MDA-MB-231 cells transfected with siRNAs. Cell viability was measured using the Cell Titer Glo assay 72 h posttransfection. Viability values are normalized to control mimic for miR-200c and to siAllStar for siRNAs. (E) Effect of individual siRNAs on siSRF transcript levels. MDA-MB-231 cells were transfected with 40 nM either individual siRNAs or pools of 4 siRNAs directed against SRF. After 48 h, RNA was isolated, and SRF transcript levels were quantified by qRT-PCR. HPRT and TFRC were used for housekeeping-gene controls. (F) RTCA migration assay of MDA-MB-231 cells transfected with siRNAs directed against SRF. MDA-MB-231 cells were transfected, starved in serum-free medium for 24 h, and seeded in RTCA CIM-16 plates. Full medium was used as a chemoattractant, and impedance measurements were performed in a time-resolved manner. Means for four replicates ± standard deviations are shown; a t test was performed for the last time point. (G) Comparison of miR-200c downstream effector levels in MDA-MB-231 cells and MCF-7 cells. Total protein was isolated from MDA-MB-231 cells and MCF-7 cells. FHOD1, PPM1F, SRF, pMLC (Thr18/Ser19), and total MLC were detected by Western blotting, using tubulin as a loading control. (H) Proposed model for miR-200c-mediated regulation of stress fibers and migration/invasion. miR-200c targets FHOD1, resulting in decreased actin polymerization and thus preventing stress fiber formation. Additionally, MRTFs are sequestered in the cytosol by increasing levels of monomeric actin, resulting in inhibition of SRF transcriptional activity and decreased expression of MLC2. Phosphorylated MLC2 is a component of active myosin, which contributes to stress fiber formation and function through cross-linking of actin filaments, and by providing contractile activity. A second miR-200c target gene, PPM1F, increases phosphorylation levels of MLC2 independently of MLC2 expression, and targeting of PPM1F might thus further enhance the effect of miR-200c on stress fiber formation.

Similar articles

Cited by

References

    1. Ahmad A, et al. 2011. Phosphoglucose Isomerase/Autocrine Motility Factor mediates epithelial-mesenchymal transition regulated by miR-200 in breast cancer cells. Cancer Res. 71:3400–3409 - PMC - PubMed
    1. Blick T, et al. 2008. Epithelial mesenchymal transition traits in human breast cancer cell lines. Clin. Exp. Metastasis 25:629–642 - PubMed
    1. Burk U, et al. 2008. A reciprocal repression between ZEB1 and members of the miR-200 family promotes EMT and invasion in cancer cells. EMBO Rep. 9:582–589 - PMC - PubMed
    1. Copeland JW, Treisman R. 2002. The diaphanous-related formin mDia1 controls serum response factor activity through its effects on actin polymerization. Mol. Biol. Cell 13:4088–4099 - PMC - PubMed
    1. Das S, Becker BN, Hoffmann FM, Mertz JE. 2009. Complete reversal of epithelial to mesenchymal transition requires inhibition of both ZEB expression and the Rho pathway. BMC Cell Biol. 10:94. - PMC - PubMed

Publication types

MeSH terms