. 2012 Jan 20;287(4):2643-51.
doi: 10.1074/jbc.M111.303594. Epub 2011 Dec 5.

Suppression of Gαs synthesis by simvastatin treatment of vascular endothelial cells

Affiliations

Suppression of Gαs synthesis by simvastatin treatment of vascular endothelial cells

Ruqin Kou et al. J Biol Chem. .

Abstract

These studies explore the effects of statins on cyclic AMP-modulated signaling pathways in vascular endothelial cells. We previously observed (Kou, R., Sartoretto, J., and Michel, T. (2009) J. Biol. Chem. 284, 14734-14743) that simvastatin treatment of endothelial cells leads to a marked decrease in PKA-modulated phosphorylation of the protein VASP. Here we show that long-term treatment of mice with simvastatin attenuates the vasorelaxation response to the β-adrenergic agonist isoproterenol, without affecting endothelin-induced vasoconstriction or carbachol-induced vasorelaxation. We found that statin treatment of endothelial cells dose-dependently inhibits PKA activation as assessed by analyses of serine 157 VASP phosphorylation as well as Epac-mediated Rap1 activation. These effects of simvastatin are completely reversed by mevalonate and by geranylgeranyl pyrophosphate, implicating geranylgeranylation as a critical determinant of the stain response. We used biochemical approaches as well as fluorescence resonance energy transfer (FRET) methods with a cAMP biosensor to show that simvastatin treatment of endothelial cells markedly inhibits cAMP accumulation in response to epinephrine. Importantly, simvastatin treatment significantly decreases Gα(s) abundance, without affecting other Gα subunits. Simvastatin treatment does not influence Gα(s) protein stability, and paradoxically increases the abundance of Gα(s) mRNA. Finally, we found that simvastatin treatment inhibits Gα(s) translation mediated by Akt/mTOR/eIF4/4EBP. Taken together, these findings establish a novel mechanism by which simvastatin modulates β-adrenergic signaling in vascular wall, and may have implications for cardiovascular therapeutics.


Figures

FIGURE 1.
FIGURE 1.
Effects of in vivo simvastatin treatment on ex vivo vascular responses. This figure shows vascular responses of arterial preparations isolated from mice treated with simvastatin (10 mg/kg) or PBS by intraperitoneal injection daily for 2 weeks. Intact femoral arteries were constricted with 100 nm endothelin-1 plus 50 μm phentolamine (to block α1 adrenergic vasoconstriction) before treatments with isoproterenol (panel A) or carbachol (panel B) at the indicated dosages. Vessel relaxation was normalized as the fractional reversal of endothelin-induced vessel contraction. The data shown were pooled from nine separate experiments, and are expressed as mean ± S.D. Statistical difference was assessed by ANOVA; the asterisk indicates p < 0.001 between the control and simvastatin-treated mice. Panel A shows the responses of arterial preparations isolated from mice treated with simvastatin or PBS to isoproterenol at indicated dosages. Panel B shows the responses of arterial preparations isolated from mice treated with simvastatin or vehicle to carbachol at indicated dosages; please note the difference in the absolute value on the ordinate compared with panel A. Panel C shows pooled data showing the maximal vascular responses of arterial preparations from mice treated with simvastatin or PBS, then exposed to isoproterenol and carbachol (leading to vasorelaxation) or to endothelin-1 (leading to vasoconstriction). Panel D shows representative immunoblots analyzed in aorta preparations of mice treated daily with PBS or simvastatin for 2 weeks. Panel E shows the quantitative analysis of pooled data from four independent experiments identical in design to panel D; the asterisk indicates p < 0.05 (ANOVA).
FIGURE 2.
FIGURE 2.
Epinephrine-stimulated VASP phosphorylation following simvastatin treatment of endothelial cells. Endothelial cells were treated with simvastatin (10 μm) for 22 h, and epinephrine was added at the indicated doses for 5 min, followed by cell harvest, and lysis. Cell lysates were analyzed in immunoblots probed with antibodies as shown. Panel A shows a series of immunoblots from a representative experiment, and panel B shows quantitative analysis of pooled data from three independent experiments; the asterisk indicates p < 0.05 (ANOVA).
FIGURE 3.
FIGURE 3.
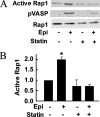
Simvastatin inhibits epinephrine-stimulated Rap1 activation in endothelial cells. Panel A shows the results of Rap1 activity assays in BAEC treated with simvastatin (10 μm) for 22 h; epinephrine was added for 5 min, and then Rap1 activation was measured using a pull-down assay. Active Rap1 and total Rap1 as well as phosphorylated VASP were detected in immunoblots probed with Rap1 and pVASP157 antibodies, respectively. This experiment was repeated three times with equivalent results. Panel B shows pooled data from three experiments identical in design to the experiment shown in panel A, normalizing the signals of active Rap1 to total Rap1; the normalized Rap1 activity in vehicle-treated cells was defined as 1.0; the asterisk indicates p < 0.05 (ANOVA).
FIGURE 4.
FIGURE 4.
Simvastatin treatment suppresses cAMP levels in cultured endothelial cells. Panel A shows a representative time course of FRET responses in endothelial cells transfected with the cAMP biosensor CFP-Epac(ΔDEP)-YFP, which were treated either with PBS (Ctl), 1 μm epinephrine (Epi), 1 μm forskolin (FSK), or 100 nm 3-isobutyl-1-methylxanthine (IBMX). Panel B shows cAMP levels from pooled experiments, calculated based on the slopes of the linear region of the time course of YFP/CFP responses from six independent experiments identical in design to the experiment shown in panel A. Panel C shows a representative time course of YFP/CFP responses in endothelial cells transfected with the cAMP biosensor for 48 h, and then incubated in the presence or absence of 10 μm simvastatin (Statin) for 22 h, and then treated either with PBS (Ctl) or 1 μm epinephrine (Epi). Panel D shows pooled data analyzing cAMP content (calculated as the YFP/CFP slope following drug addition) from six independent experiments identical in design to the experiment shown in panel C. Panel E shows the results of cAMP measurements quantitated using an EIA kit; endothelial cells were treated with 10 μm simvastatin (statin) or with vehicle (Ctl) for 22 h, and then treated for 5 min with varying doses of epinephrine (Epi) as indicated. Panel F shows pooled data from four experiments analyzing cAMP levels using an EIA kit in endothelial cells treated for 22 h with vehicle (Ctl) or 10 μm simvastatin (S), either alone or in the presence of mevalonate (400 μm), or GGpp (10 μm), as indicated. The asterisk indicates p < 0.05 (ANOVA) compared with cells incubated with vehicle.
FIGURE 5.
FIGURE 5.
Simvastatin treatment decreases Gαs abundance in cultured endothelial cells. Shown are immunoblot results obtained following statin treatments of endothelial cells (panels A and B) or vascular smooth muscle cells (panels C and D). Cells were treated for 22 h with simvastatin (10 μm) alone, or in the presence of mevalonate (400 μm), or GGpp (10 μm) or Fpp (10 μm) followed by cell lysis. Cell lysates were analyzed in immunoblot probed with antibodies as shown. Panels A and C show representative immunoblots, and panels B and D show quantitative analysis of pooled data from three independent experiments identical in design to the representative experiments shown above; the asterisk indicates p < 0.05 (ANOVA).
FIGURE 6.
FIGURE 6.
Simvastatin treatment decreases Gαs abundance. Endothelial cells were treated with varying doses of simvastatin for 22 h or with 10 μm simvastatin for varying times as indicated. Cells were harvested and cell lysates analyzed in immunoblots probed with antibodies directed against Gαs and β-actin, as indicated. Panels A and C show representative immunoblot experiments, which were repeated five times with equivalent results; Panels B and D present pooled data, quantitating the immunoblot signals using digital chemiluminescence imaging. The basal phosphorylation in vehicle-treated cells was 1.0. The asterisk indicates p < 0.05 (ANOVA).
FIGURE 7.
FIGURE 7.
Simvastatin and Gαs protein stability in cultured endothelial cells. Panel A shown a representative immunoblot experiment in endothelial cells treated with 10 μm simvastatin for 22 h plus 10 ng/ml cycloheximide for the indicated times. Cells were harvested and cell lysates analyzed in immunoblots probed with antibodies directed against Gαs and β-actin, as indicated. Panel B shows quantitative analysis of pooled data from three independent experiments. Panel C shows the representative result of a pulse-chase experiment, in which newly synthesized proteins were labeled with 35S for 2 h and chased while cells were treated with PBS or 10 μm simvastatin for the indicated times followed by cell lysis. The abundance of 35S-labeled Gαs in cell lysates was analyzed by immunoprecipitation with a Gαs antibody followed with SDS-PAGE, and then quantified with a Cyclone PhosphorImager. Shown below are immunoblots of β-actin in cell lysates as a loading control. Panel D shows quantitative analyses of three experiments identical in design to the experiment shown in panel C.
FIGURE 8.
FIGURE 8.
Effects of simvastatin on phosphorylation of proteins involved in translational regulation. Panel A shows pooled data from three experiments of real-time PCR for Gαs in endothelial cells treated with PBS or 10 μm simvastatin for 22 h; the asterisk indicates p < 0.05. Panel B shows representative results of immunoblots analyzed in endothelial cells treated with simvastatin (10 μm) alone, or in the presence of mevalonate (400 μm), GGpp (10 μm), or Fpp (10 μm) for 22 h followed by cell lysis. Cell lysates were analyzed in immunoblots probed with antibodies as shown. Panel C shows pooled data from three experiments identical in design to the experiment shown in panel B, quantitating the immunoblot signals using digital chemiluminescence imaging, setting the basal phosphorylation in vehicle-treated cells at 1.0. The asterisk indicates p < 0.05 compared with the basal level of phosphorylation. Panel D shows immunoblots analyzed in endothelial cells treated for 22 h with varying doses of simvastatin; cell lysates were analyzed in immunoblots probed with specific antibodies as indicated. Panel E shows the results of immunoblot analyzed in endothelial cells treated with 10 μm simvastatin for varying times. Cells were harvested and cell lysates analyzed in immunoblots probed with antibodies as shown. All experiments were performed at least three times with similar results.
FIGURE 9.
FIGURE 9.
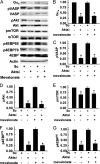
siRNA-mediated Akt knockdown modulates Gαs abundance and phosphorylation of proteins involved in translational regulation. Panel A shows representative immunoblots analyzed in endothelial cells transfected with control siRNA or Akt siRNA as noted, then incubated with or without the mevalonate (400 μm) for 22 h. Cell lysates were analyzed in immunoblots probed with antibodies as shown. Panels B–G show pooled data from three experiments identical in design to the experiment shown in panel A, quantitating the immunoblot signals using digital chemiluminescence imaging and normalizing the basal signals in vehicle-treated cells at 1.0. The asterisk indicates p < 0.05 (by ANOVA) compared with the basal level of phosphorylation. All experiments were performed at least three times with similar results.
FIGURE 10.
FIGURE 10.
In vivo simvastatin treatment and phosphorylation of aortic proteins involved in translational regulation. Panel A shows representative immunoblots analyzed in aorta preparations isolated from mice that had been treated by intraperitoneal injection daily for 2 weeks with PBS (left lane) or simvastatin (right lane). Panels B–D show quantitative analyses of pooled data from four independent experiments identical in design to panel A; the asterisk indicates p < 0.05 (ANOVA).

Similar articles

Cited by

References

    1. Ponsioen B., Zhao J., Riedl J., Zwartkruis F., van der Krogt G., Zaccolo M., Moolenaar W. H., Bos J. L., Jalink K. (2004) Detecting cAMP-induced Epac activation by fluorescence resonance energy transfer: Epac as a novel cAMP indicator. EMBO Rep. 5, 1176–1180 - PMC - PubMed
    1. Jain M. K., Ridker P. M. (2005) Anti-inflammatory effects of statins: clinical evidence and basic mechanisms. Nat. Rev. Drug Discov. 4, 977–987 - PubMed
    1. Mühlhäuser U., Zolk O., Rau T., Münzel F., Wieland T., Eschenhagen T. (2006) Atorvastatin desensitizes β-adrenergic signaling in cardiac myocytes via reduced isoprenylation of G-protein γ-subunits. FASEB J. 20, 785–787 - PubMed
    1. Kou R., Sartoretto J., Michel T. (2009) Regulation of Rac1 by simvastatin in endothelial cells: differential roles of AMP-activated protein kinase and calmodulin-dependent kinase kinase-β. J. Biol. Chem. 284, 14734–14743 - PMC - PubMed
    1. Igarashi J., Bernier S. G., Michel T. (2001) Sphingosine 1-phosphate and activation of endothelial nitric-oxide synthase. differential regulation of Akt and MAP kinase pathways by EDG and bradykinin receptors in vascular endothelial cells. J. Biol. Chem. 276, 12420–12426 - PubMed

Publication types

MeSH terms

Substances