. 2011 Dec 12;195(6):1033-45.
doi: 10.1083/jcb.201104037. Epub 2011 Dec 5.

Eph receptor function is modulated by heterooligomerization of A and B type Eph receptors

Affiliations

Eph receptor function is modulated by heterooligomerization of A and B type Eph receptors

Peter W Janes et al. J Cell Biol. .

Abstract

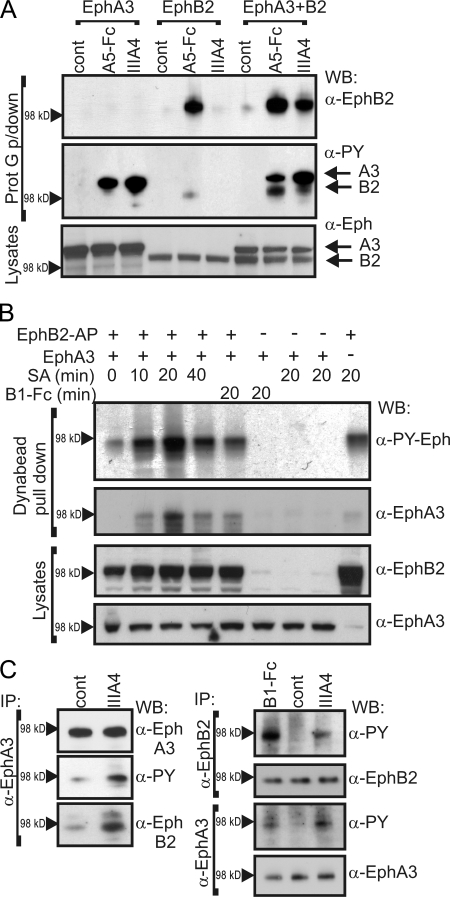
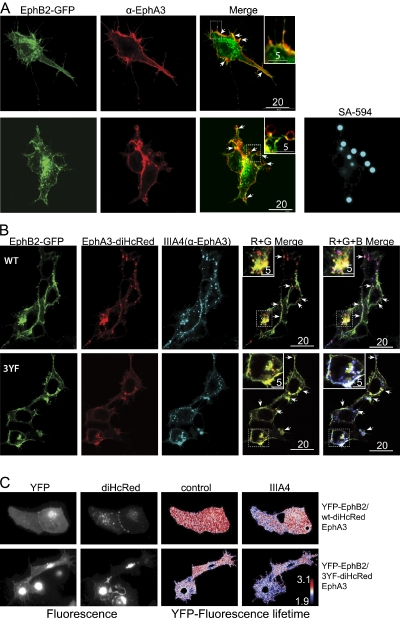
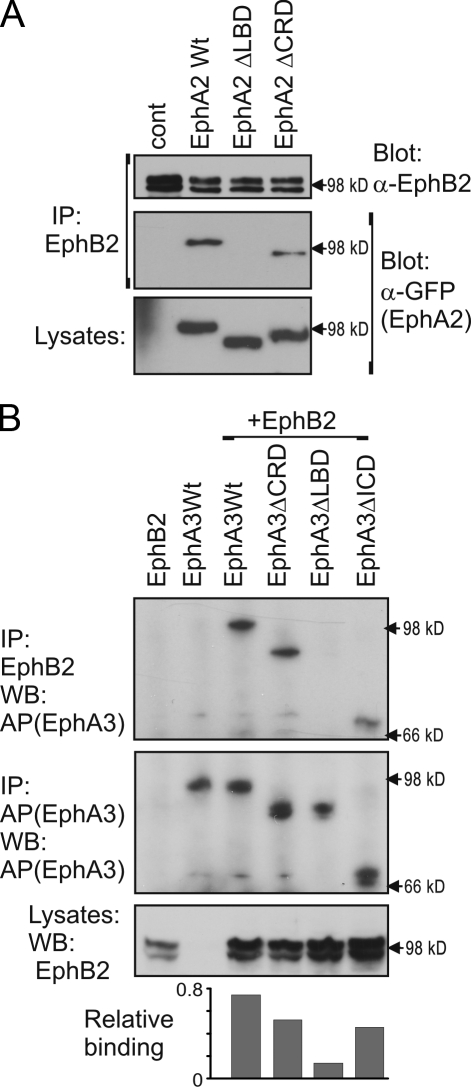
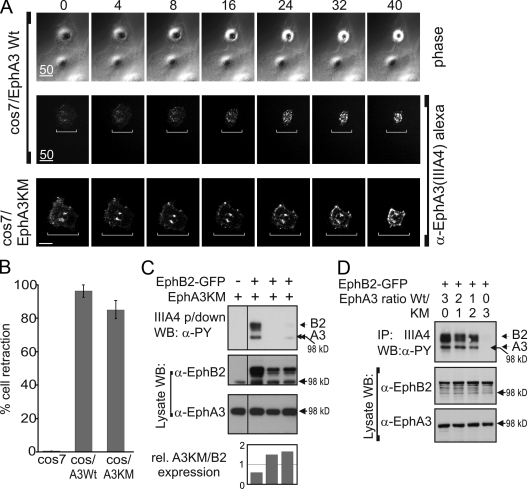
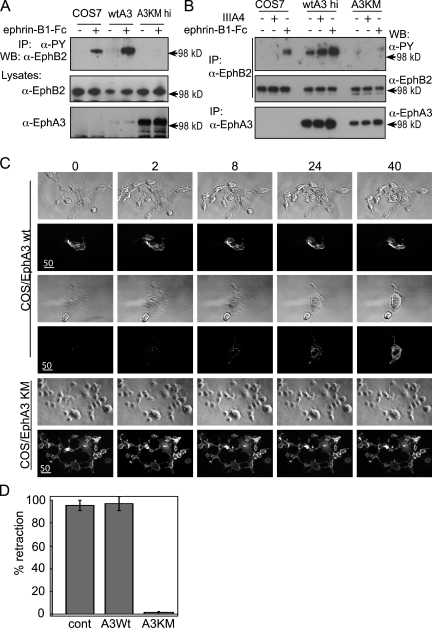
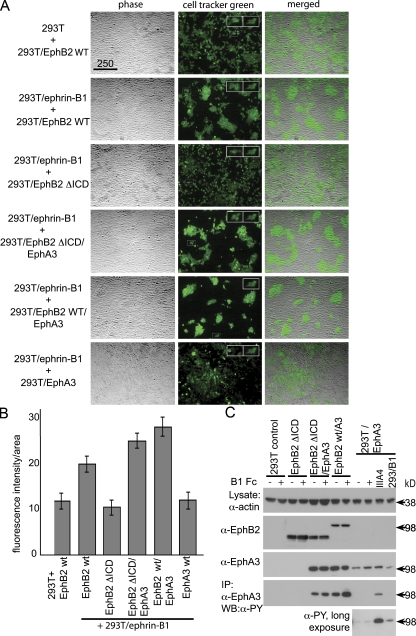
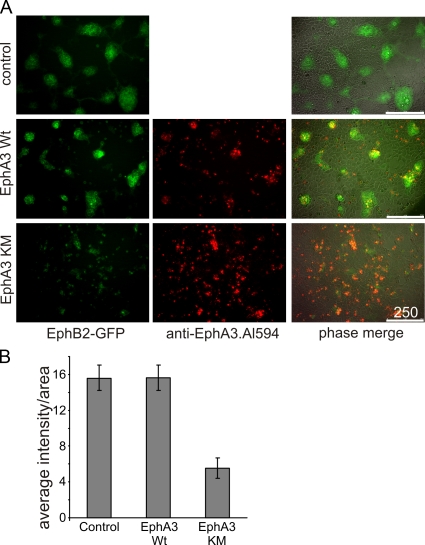
Eph receptors interact with ephrin ligands on adjacent cells to facilitate tissue patterning during normal and oncogenic development, in which unscheduled expression and somatic mutations contribute to tumor progression. EphA and B subtypes preferentially bind A- and B-type ephrins, respectively, resulting in receptor complexes that propagate via homotypic Eph-Eph interactions. We now show that EphA and B receptors cocluster, such that specific ligation of one receptor promotes recruitment and cross-activation of the other. Remarkably, coexpression of a kinase-inactive mutant EphA3 with wild-type EphB2 can cause either cross-activation or cross-inhibition, depending on relative expression. Our findings indicate that cellular responses to ephrin contact are determined by the EphA/EphB receptor profile on a given cell rather than the individual Eph subclass. Importantly, they imply that in tumor cells coexpressing different Ephs, functional mutations in one subtype may cause phenotypes that are a result of altered signaling from heterotypic rather from homotypic Eph clusters.


Figures

Figure 1.
Figure 1.
EphA3 and EphB2 coIP from cells and are coactivated by receptor-specific stimulation. (A) HEK293T cells transfected with diHcRed-EphA3 or GFP-EphB2 were stimulated for 15 min with ephrin-A5-Fc (A5-Fc), α-EphA3 mAb (IIIA4), or not stimulated (control [cont]). Ephrin or IIIA4-bound receptors were analyzed by a WB with the indicated antibodies. To control loading, lysates were blotted with α-EphA3 and α-EphB2 antibodies (bottom). Prot G p/down, protein G pull-down. (B) HEK293T cells transfected with EphA3 and/or with biotin ligase–treated AP-EphB2 were incubated with SA-coated Dynabeads for various times or with ephrin-B1-Fc/protein A Dynabeads as a control. Beads were recovered from cell lysates, and associated proteins were analyzed by a WB with α-EphA3 or α–PY-EphA3 antibodies. To control loading, total lysates were also blotted with α-EphA3 and α-EphB2 antibodies (bottom panels). (C) U251 glioma cells were treated with cross-linked IIIA4 and ephrin-B1-Fc to specifically activate EphA3 and EphB2, respectively, or left untreated (cont). (left) EphA3 IPs were immunoblotted for EphA3, PY, or associated EphB2. (right) Parallel EphB2 and EphA3 IPs were immunoblotted with α-EphA3, -EphB2, and -PY antibodies, as indicated.
Figure 2.
Figure 2.
Association of EphA3 and EphB2 in intact cells. (A) Colocalization of AP-EphA3 and GFP-EphB2 in cells. HEK293 cells expressing biotinylated AP-EphA3 were transfected with GFP-EphB2. After 24 h, cells were stained with Alexa Fluor 647 α-EphA3 (IIIA4; red) before (top) or after (bottom) the addition of Alexa Fluor 594 SA–coated beads for 20 min, fixed, and imaged by confocal microscopy. (B) Cointernalization of EphA3 and EphB2. HEK293 cells were transfected with Wt diHcRed-EphA3 and Wt GFP-EphB2 or inactive mutant GFP-EphB2[3YF]. After 24 h, cells were stimulated for 20 min with cross-linked Alexa Fluor 647 IIIA4 before fixation and confocal microscopy. (A and B) Arrows indicate prominent colocalization. Insets show details in boxed areas at higher magnification. (C) Fluorescence lifetime microscopy shows close association of YFP-EphB2 and Wt or diHcRed-EphA3[3YF] in live cells. COS7 cells were transfected with YFP-EphB2 and Wt or 3YF mutant diHcRed-EphA3, and FRET between YFP and diHcRed was analyzed by FLIM before and after 40 min of stimulation with clustered IIIA4. YFP fluorescence lifetime maps are illustrated together with confocal micrographs of YFP-EphB2 and diHcRed-EphA3–transfected COS7 cells. All scale bars are in micrometers.
Figure 3.
Figure 3.
Eph extracellular domains mediate heterooligomerization. (A) HEK293T cells were transfected with Wt EphB2 alone (control [cont]) or with GFP-tagged EphA2 constructs, either full length (Wt) or lacking the ΔLBD or ΔCRD. EphB2 IPs were analyzed for associated GFP-EphA2 by an α-GFP WB and an α-EphB2 blot to confirm equal loading. Relative expression of GFP-EphA2 constructs was assessed by a WB of total cell lysates (bottom). (B) HEK293 cells were transfected with Wt EphB2 and AP-EphA3, full length (Wt) or lacking the ΔCRD, ΔLBD, or intracellular domain (ΔICD). EphB2 IPs were analyzed for associated AP-EphA3 by an α-AP WB. Relative expression of constructs was tested by an α-AP IP/WB and anti-EphB2 blots of total cell lysates. The graph shows relative EphA3 coIP/EphA3 expression from densitometry. A representative dataset from two independent experiments is shown.
Figure 4.
Figure 4.
Cross-activation of EphA3 and B2 can rescue an inactivated EphA3 receptor to induce cell retraction. (A) Wt or EphA3[KM]-expressing COS7 cells were stimulated with Alexa Fluor 594–α–EphA3-mAb IIIA4 and imaged by brightfield (top row) and fluorescence (bottom rows) live-cell microscopy. Brackets in the fluorescent images depict cell diameters at the start of the experiment. The numbers above the images refer to time in minutes. All scale bars are in micrometers. (B) Quantification of parental COS7 or Wt- or EphA3[KM]-expressing cells retracting after IIIA4 stimulation, analyzed as in A (mean ± SEM; >90 cells/point from multiple fields). (C) Phosphorylation of EphA3[KM] by coexpression with EphB2. HEK293T cells, cotransfected with varying amounts of EphA3 (KM mutant) and GFP-EphB2, were stimulated with cross-linked IIIA4 and IIIA4-bound complexes analyzed by an α-PY WB. Antireceptor blots of lysates show relative expression levels, with irrelevant lanes removed. The graphs show relative EphA3/B2 (rel. A3KM/B2) expression from densitometry, using a representative dataset from two independent experiments. Black lines indicate that intervening lanes have been spliced out. p/down, pull-down. (D) Kinase-inactive EphA3 suppresses EphB2 activity. HEK293 cells transfected with constant levels of GFP-EphB2 and EphA3 (varying ratios of Wt to EphA3[KM], as indicated) and IIIA4-stimulated complexes were recovered on and Western blotted with α-PY antibodies. Cell lysates were also blotted for EphB2 and EphA3 as controls.
Figure 5.
Figure 5.
Overexpression of kinase-dead EphA3 blocks EphB2 activation and cell retraction. Comparison of EphB2 phosphorylation in Wt EphA3 and EphA3[KM] COS7 cell lines. (A) Parental COS7 cells (COS7) and clones stably expressing Wt EphA3 (wtA3) or high levels of K653M-EphA3 (A3KM hi) stimulated for 15 min with ephrin-B1-Fc were lysed, and α-PY Sepharose (4G10) IPs were analyzed by an α-EphB2 WB. α-EphA3 and α-EphB2 blots from total cell lysate antibodies show relative receptor expression levels. (B) Parental COS7 cells and clones stably overexpressing high levels of Wt EphA3 (wt EphA3 hi) or moderate levels of EphA3[KM] were stimulated with ephrin-B1-Fc or IIIA4, and α-EphB2 and -EphA3 IPs were Western blotted for EphB2 phosphorylation and Eph receptor expression levels, as indicated. (C) Ephrin-B1–induced cell retraction is blocked by exogenous kinase-dead EphA3. COS7 cells overexpressing Wt EphA3 (top four rows) or EphA3[KM] (bottom two rows) were labeled with (noncross-linked) Alexa Fluor 594 IIIA4 to indicate EphA3 expression, stimulated with cross-linked ephrin-B1-Fc, and analyzed by time-lapse fluorescence live-cell imaging. Cell retraction is imaged in a group of three cells that are part of a larger cell cluster (top two rows) and also in a single EphA3 Wt–expressing cell demonstrating more pronounced cell contraction (middle two rows). The numbers above the images refer to time in minutes. All scale bars are in micrometers. (D) The percentage of retracting cells with detectable EphA3 expression was quantified from B and compared with levels of parental COS7 cells (mean ± SEM; n > 3). cont, control.
Figure 6.
Figure 6.
EphA3 rescues defective cell segregation of EphB2ΔICD cells from ephrin-B1 cells. (A) Ephrin-B1 HEK293 cells were cocultured with CellTracker green–labeled HEK293 cells expressing the indicated combinations of Wt or truncated EphB2 (ΔICD) and EphA3. At confluency (2–3 d), cells were fixed and imaged by phase-contrast and fluorescence microscopy. The scale bar shown is in micrometers. (B) Segregation of green-labeled and nonlabeled HEK293T cells was determined by measuring the tightness of (green) HEK293 cell aggregation and quantified by estimating mean fluorescence intensity per total fluorescence area (>12 random fields/condition). To illustrate equal fluorescence intensity of CellTracker green–labeled cells, insets in A illustrate comparisons of individual nonclustered cells (magnified from areas defined by dashed boxes) with those selected from the coculture of ephrin-B1/HEK293T and (green) Wt EphB2/EphA3 cells with maximal cell segregation. Statistical relevance of observed differences between all groups was determined using the analysis of variance (ANOVA) test for multiple comparisons. Means with error bars indicating 95% confidence intervals (ANOVA) are shown. (C) EphA3 is activated in response to ephrin-B1-Fc in Wt EphB2 and EphB2[ΔICD]-coexpressing cells but not in cells lacking EphB2. HEK293T cell lines illustrated in A were analyzed for EphA3 phosphorylation in response to cross-linked ephrin-B1-Fc by analyzing α-EphA3 IPs by an α-PY WB. To test ephrin-B1 stimulation of EphA3, EphA3/HEK293T cells were incubated with ephrin-B1-Fc, IIIA4 (positive control), or ephrinB1/293 cells. To control loading, lysates were blotted for EphA3 and EphB2 levels.
Figure 7.
Figure 7.
Overexpression of kinase-inactive EphA3 causes dominant-negative inhibition of ephrin-B1/EphB2–mediated cell segregation. (A) GFP-EphB2/HEK293 cells, transfected with Wt or EphA3[KM], were stained with Alexa Fluor 594 α-EphA3 mAb and enriched by FACS. Transfected or control GFP-EphB2/HEK293T cells were cocultured with ephrin-B1/HEK293T cells until confluent before imaging by fluorescence microscopy. All scale bars are in micrometers. (B) Segregation of GFP-EphB2/HEK293T and ephrin-B1/HEK293T cells was quantified as in Fig. 6 (10 random fields/condition). The graph shows means with error bars indicating 95% confidence intervals (ANOVA test for multiple comparisons).

References

    1. Alonso-C L.M., Trinidad E.M., de Garcillan B., Ballesteros M., Castellanos M., Cotillo I., Muñoz J.J., Zapata A.G. 2009. Expression profile of Eph receptors and ephrin ligands in healthy human B lymphocytes and chronic lymphocytic leukemia B-cells. Leuk. Res. 33:395–406 10.1016/j.leukres.2008.08.010 - DOI - PubMed
    1. Astin J.W., Batson J., Kadir S., Charlet J., Persad R.A., Gillatt D., Oxley J.D., Nobes C.D. 2010. Competition amongst Eph receptors regulates contact inhibition of locomotion and invasiveness in prostate cancer cells. Nat. Cell Biol. 12:1194–1204 10.1038/ncb2122 - DOI - PubMed
    1. Batlle E., Bacani J., Begthel H., Jonkheer S., Gregorieff A., van de Born M., Malats N., Sancho E., Boon E., Pawson T., et al. 2005. EphB receptor activity suppresses colorectal cancer progression. Nature. 435:1126–1130 10.1038/nature03626 - DOI - PubMed
    1. Binns K.L., Taylor P.P., Sicheri F., Pawson T., Holland S.J. 2000. Phosphorylation of tyrosine residues in the kinase domain and juxtamembrane region regulates the biological and catalytic activities of Eph receptors. Mol. Cell. Biol. 20:4791–4805 10.1128/MCB.20.13.4791-4805.2000 - DOI - PMC - PubMed
    1. Brown A., Yates P.A., Burrola P., Ortuño D., Vaidya A., Jessell T.M., Pfaff S.L., O’Leary D.D., Lemke G. 2000. Topographic mapping from the retina to the midbrain is controlled by relative but not absolute levels of EphA receptor signaling. Cell. 102:77–88 10.1016/S0092-8674(00)00012-X - DOI - PubMed

Publication types

Substances