. 2011 Dec;7(12):e1002228.
doi: 10.1371/journal.pcbi.1002228. Epub 2011 Dec 1.

Comparative microbial modules resource: generation and visualization of multi-species biclusters

Affiliations

Comparative microbial modules resource: generation and visualization of multi-species biclusters

Thadeous Kacmarczyk et al. PLoS Comput Biol. 2011 Dec.

Abstract

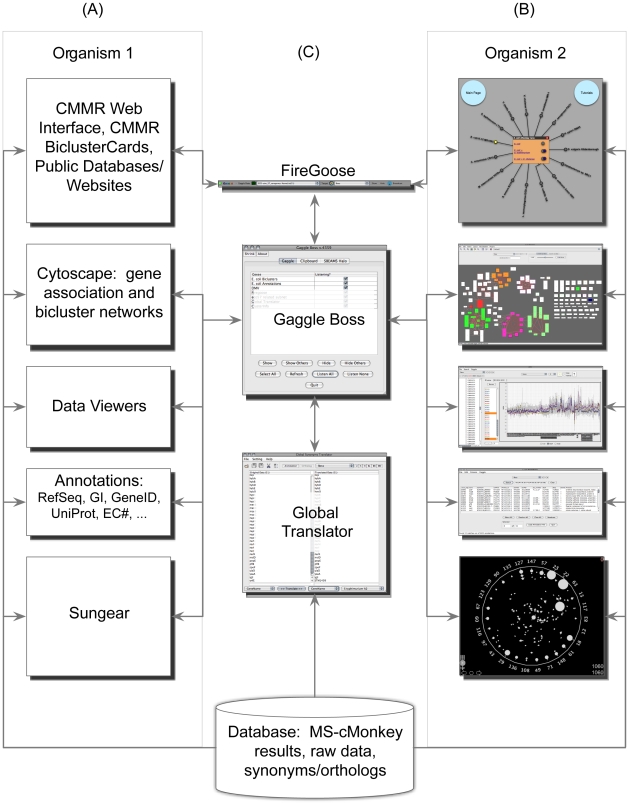
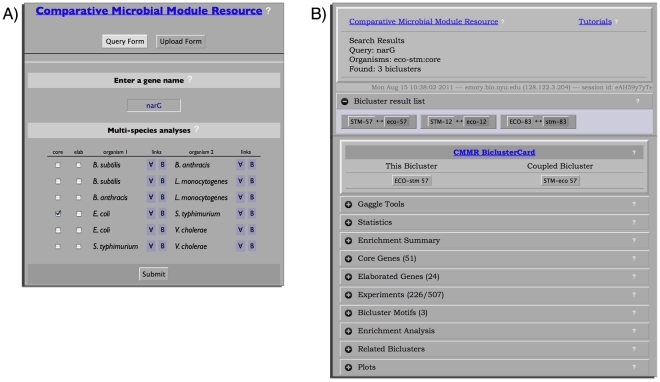
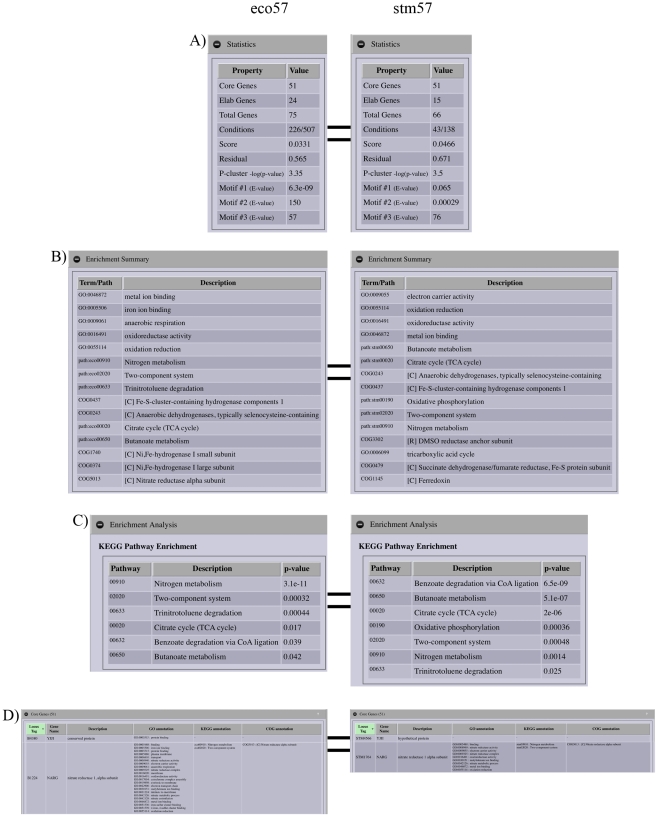
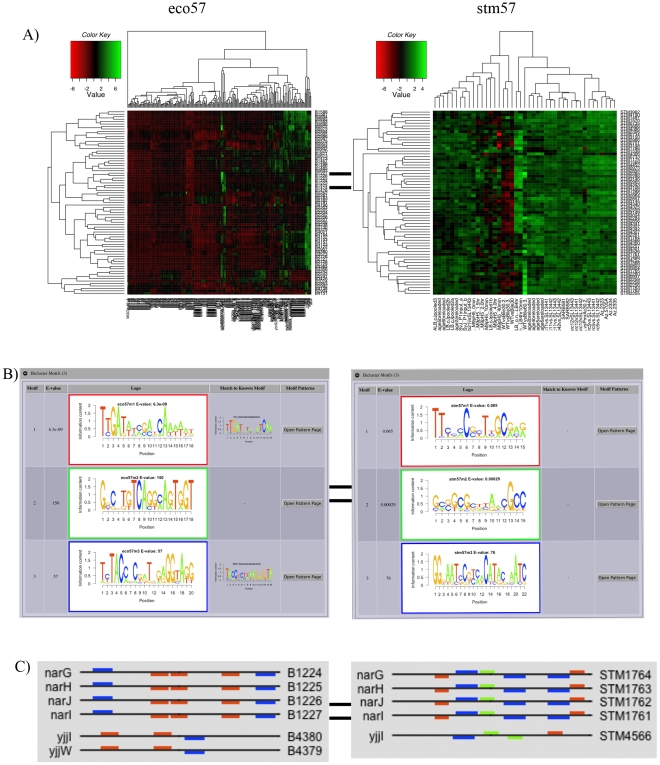
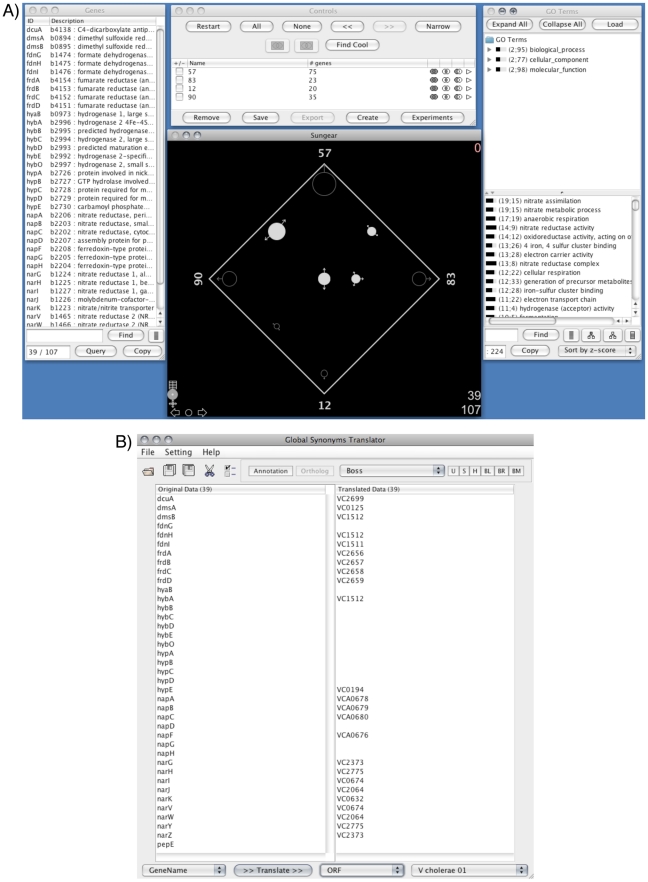
The increasing abundance of large-scale, high-throughput datasets for many closely related organisms provides opportunities for comparative analysis via the simultaneous biclustering of datasets from multiple species. These analyses require a reformulation of how to organize multi-species datasets and visualize comparative genomics data analyses results. Recently, we developed a method, multi-species cMonkey, which integrates heterogeneous high-throughput datatypes from multiple species to identify conserved regulatory modules. Here we present an integrated data visualization system, built upon the Gaggle, enabling exploration of our method's results (available at http://meatwad.bio.nyu.edu/cmmr.html). The system can also be used to explore other comparative genomics datasets and outputs from other data analysis procedures - results from other multiple-species clustering programs or from independent clustering of different single-species datasets. We provide an example use of our system for two bacteria, Escherichia coli and Salmonella Typhimurium. We illustrate the use of our system by exploring conserved biclusters involved in nitrogen metabolism, uncovering a putative function for yjjI, a currently uncharacterized gene that we predict to be involved in nitrogen assimilation.


Conflict of interest statement

The authors have declared that no competing interests exist.

Figures

Figure 1
Figure 1. Overview of the Comparative Microbial Module Resource components (CMMR).
The CMMR consists of an integrated suite of web components for visualizing the diverse aspects of the multi-species, multi-datatype analysis; facilitating access to each organism's dataset. (A) Written descriptions of the individual components for hypothetical Organism 1. (B) The corresponding graphics of each component goose displaying example data, for hypothetical Organism 2. Each of the components fetches information from the data compendium (MScM results, and raw data). (C) The CMMR integrative components: the FireGoose allows transfer of data between web pages and gaggled software, the Gaggle Boss acts as a hub for passing communications among the geese, and the Global Synonym/Ortholog Translator converts among gene annotations, accessions and translates orthologous genes between organisms. The arrows represent information flow between tools, primarily as broadcasts between tools and the Gaggle boss.
Figure 2
Figure 2. CMMR Query Page and BiclusterCard.
The CMMR web interface allows users to search for biclusters of interest, with each resulting bicluster displayed in a BiclusterCard format. (A) The CMMR search page showing the title links to the CMMR wiki, query form button, upload form button, and input fields. Shown is the query form with an example search for narG in the core set (check box) of bicluster gene members for a MScM run of E. coliS. Typhimurium. (B) The result page from this search – a user has access to the CMMR wiki, tutorials, a brief description of the search query, the resulting bicluster list and BiclusterCards. The BiclusterCard contains links to Gaggle tools, and expandable/collapsible tabs to display the bicluster's diverse supporting information. There are help icons with mouseover tooltips for descriptions and information.
Figure 3
Figure 3. BiclusterCard components I: Statistics, Enrichment Summary, Core Gene Table, KEGG Pathway Enrichment.
The BiclusterCard is a summary of the information supporting a bicluster, including links to online tools and source data. Shown in the figure are the expanded tabs for: statistics, enrichment summary from COG, GO and KEGG enrichment analysis, KEGG pathway enrichment, and core gene table for multi-species bicluster E. coliS. Typhimurium bicluster 57. (A) Statistics tab for eco57 (left) and stm57 (right) displays a table with the following columns: Property and Value. The information contained in this table includes: the number of core and elaborated genes, fraction of conditions in the bicluster, the bicluster score, bicluster residual, bicluster mean p-value (mean of all motifs found in the promoter sequences), and the E-value for each motif found in the bicluster. (B) Enrichment Summary tab for eco57 (top) and stm57 (bottom) displays a table with the following columns: Term/Pathway and Description. This table lists the most significant annotations from ontological enrichment tests of COG, KEGG pathway, and GO annotations. (C) The Functional Enrichment tab displays tables listing the significant annotations from the COG, GO and KEGG enrichment analyses. Shown is the KEGG pathway enrichment table for eco57 (top) and stm57 (bottom). The table consists of the following columns: Pathway, Description, and p-value. Each column can be sorted. (D) Core Gene tab for eco57 (top) and stm57 (bottom), showing the number of core genes (51), and a table containing the following columns: Locus Tag, Gene Name, Description, GO annotations, KEGG annotations, and COG annotations. Locus Tag, Gene Name and Description columns can be sorted.
Figure 4
Figure 4. BiclusterCard components II: Bicluster Motifs, Upstream Patterns, Plots.
Shown in the figure are, the expanded tab for Plots displaying a gene expression heatmap, the expanded tab for Bicluster Motifs, and an example of the upstream motif patterns for multi-species bicluster E. coliS. Typhimurium bicluster 57. (A) Example plot of a gene expression heatmap for the bicluster genes and conditions in eco57 (left) and stm57 (right); upregulated expression (green) and downregulated expression (red). (B) Putative regulatory sequence motifs found in bicluster gene member promoters for eco57 (left) and stm57 (right). The table displays a row for each motif found and columns for the motif number, E-value, sequence logo, matches to any known motifs, and a link to motif pattern page. Eco57 motif #1 matches the known FNR binding sequence and motif #3 matches the known NarP binding sequence. (C) The promoter motif patterns for the motifs shown in (B) for eco57 (left) and stm57 (right). The location of the motifs are represented by colored rectangles on the promoter sequence (black line) and the colors correspond to the logo border colors seen in (B); motif #1 (red), motif #2 (green) motif #3 (blue). For the bicluster gene members shown, bicluster motifs #1 and #3 appear in the promoter regions of the eco57 members, whereas all three bicluster motifs appear in the promoters for the stm57 members. The identical motif pattern indicates MScM has determined them to be in an operon. It is known that narGHJI exist as an operon, but MScM has determined that yjjI is in an operon with yjjW (this is also predicted by [62]). However, yjjW is found only in the elaborated gene set of eco57 and it is not found in stm57.
Figure 5
Figure 5. CMMR linked Gaggled tools I: Gene Network, Data Matrix Viewer, Bicluster Network.
Expanding the Gaggle tools tab on the BiclusterCard for multi-species bicluster E. coliS. Typhimurium bicluster 57, reveals a list of links (buttons) to the various Gaggle tools. (A) The Gene Associations button opens a Cytoscape goose that displays the core genes subnetwork for eco57 (top) and stm57 (bottom). The nodes represent genes and edges represent associations based on data from the compendium, indicated in yellow is gene yjjI. Edges are shared annotations: COG code (pink), Prolinks phylogenetic profile (purple), metabolic pathway (blue), operon (light cyan), and Predictome phylogenetic pattern (dark cyan). (B) The expression profiles for the genes and conditions from eco57 (top) and stm57 (bottom) can be explored by opening the Data Matrix Viewer. Using the FireGoose, the bicluster's genes and conditions can be broadcast from the BiclusterCard. We can see how the expression profile of gene yjjI (indicated by the colored line) matches other profiles in the bicluster. (C) The Bicluster Network button opens a Cytoscape goose to display the complete bicluster network where each node is a bicluster (width and height proportional to number of genes and conditions, respectively) and edges represent any shared properties and annotations. We can explore the related bicluster subnetwork for bicluster 57 (yellow), eco57 (left) and stm57 (right), by broadcasting the list of related biclusters (using the FireGoose) from the BiclusterCard to select those biclusters and display them in a new window. There are 10 additional biclusters in the eco57 subnetwork. Node fill color represents significant COG annotation, border color represents significant GO annotation, node border thickness represents residual, and edge color represents shared COG (green) KEGG (red), or GO (blue) annotations.
Figure 6
Figure 6. CMMR linked Gaggled tools II: Sungear and Global Synonym/Ortholog Translator.
The Sungear goose is a visualization tool capable of displaying set relationships and operations (intersections, complements, unions). In this case, sets are gene lists from a gaggle broadcast. (A) Four biclusters were broadcast to Sungear: eco57, eco83, eco12, and eco90. Each bicluster is represented as a vertex or anchor on the square and the circles, called vessels, represent the intersection of elements, in this case, bicluster gene members (bottom center window). Selected are four circles (filled circles) representing the intersections of gene members for bicluster 57 with the other three biclusters, 83, 12, and 90. The list of genes from the selected sets is seen in the gene list window (left window). Manipulation of the sets is done through the control window (top center window). Over representation of GO terms are shown in the GO term window (right window). (B) The list of 39 E. coli genes (left panel) was broadcast to the Global Synonym/Ortholog Translator to find 24 putative orthologous genes (right panel) in V. cholerae.

Similar articles

Cited by

References

    1. Altschul SF, Madden TL, Schaffer AA, Zhang J, Zhang Z, et al. Gapped BLAST and PSI-BLAST: a new generation of protein database search programs. Nucleic Acids Res. 1997;25:3389–3402. - PMC - PubMed
    1. Chikina MD, Troyanskaya OG. Accurate quantification of functional analogy among close homologs. PLoS Comput Biol. 2011;7:e1001074. - PMC - PubMed
    1. Ihmels J, Bergmann S, Berman J, Barkai N. Comparative gene expression analysis by differential clustering approach: application to the Candida albicans transcription program. PLoS Genet. 2005;1:e39. - PMC - PubMed
    1. Lu Y, Huggins P, Bar-Joseph Z. Cross species analysis of microarray expression data. Bioinformatics. 2009;25:1476–1483. - PMC - PubMed
    1. Stuart JM, Segal E, Koller D, Kim SK. A gene-coexpression network for global discovery of conserved genetic modules. Science. 2003;302:249–255. - PubMed

Publication types

LinkOut - more resources