. 2011 Dec;7(12):e1002256.
doi: 10.1371/journal.pcbi.1002256. Epub 2011 Dec 1.

Validation of skeletal muscle cis-regulatory module predictions reveals nucleotide composition bias in functional enhancers

Affiliations

Validation of skeletal muscle cis-regulatory module predictions reveals nucleotide composition bias in functional enhancers

Andrew T Kwon et al. PLoS Comput Biol. 2011 Dec.

Abstract

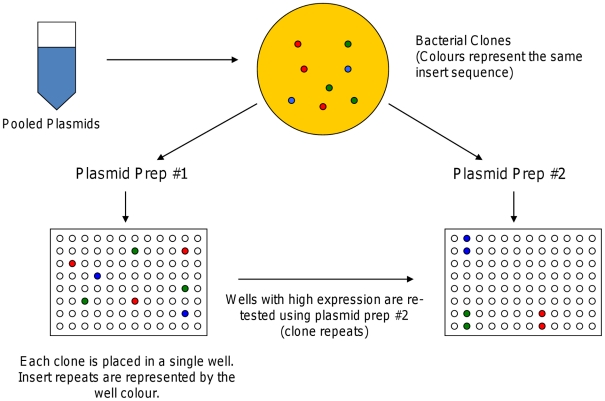
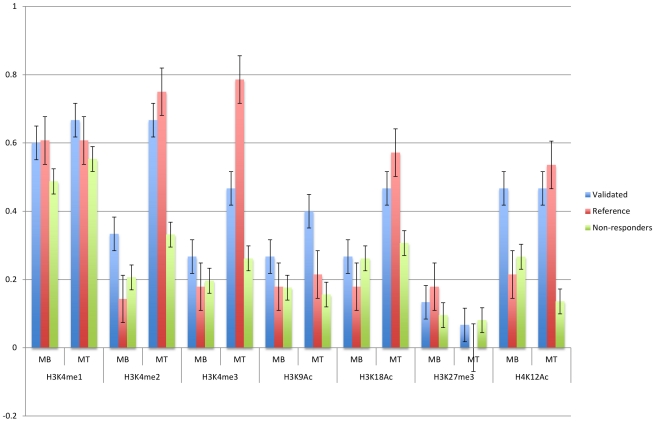
We performed a genome-wide scan for muscle-specific cis-regulatory modules (CRMs) using three computational prediction programs. Based on the predictions, 339 candidate CRMs were tested in cell culture with NIH3T3 fibroblasts and C2C12 myoblasts for capacity to direct selective reporter gene expression to differentiated C2C12 myotubes. A subset of 19 CRMs validated as functional in the assay. The rate of predictive success reveals striking limitations of computational regulatory sequence analysis methods for CRM discovery. Motif-based methods performed no better than predictions based only on sequence conservation. Analysis of the properties of the functional sequences relative to inactive sequences identifies nucleotide sequence composition can be an important characteristic to incorporate in future methods for improved predictive specificity. Muscle-related TFBSs predicted within the functional sequences display greater sequence conservation than non-TFBS flanking regions. Comparison with recent MyoD and histone modification ChIP-Seq data supports the validity of the functional regions.


Conflict of interest statement

The authors have declared that no competing interests exist.

Figures

Figure 1
Figure 1. Selection of clones for differential expression analysis.
The selection is divided into 2 phases, where the clones selected for Phase 2 are a subset of all clones tested in Phase 1. Phase 1 and Phase 2 samples are from different plasmid preparations.
Figure 2
Figure 2. Dinucleotide frequencies in responding regions vs. non-responding regions.
a) Muscle Regulatory Regions. Muscle Validated = 19 validated muscle regions in this study. Muscle Reference = 28 muscle reference regions from literature. Muscle Non-Responders = all regions that were tested in this study and found not to drive gene expression. b) Pleiades Curated Regulatory Regions. Pleiades Curated All = 1341 curated regulatory regions from all species. Pleiades Curated Human = 631 curated regulatory regions in humans only. Non-Responders = all regions that were tested and found not to drive gene expression.
Figure 3
Figure 3. Examples of positive regions.
Muscle TFBS hits (threshold of 80%) and the phastCons conservation profile for the region are shown as well. When square brackets are shown, they indicate the original CRM prediction. a) Positive sequence from the muscle set. The muscle-specific TFBS are located in regions of high sequence conservation. b) Positive sequence from the non-muscle. This sequence showed the most consistent increase in reporter expression, with all 12 replicates determined as significantly up-regulated in muscle. c) Positive sequence from the background set. Despite the clear cluster of muscle-specific TFBS located in the region of high sequence conservation, none of the CRM prediction tools could classify this as a muscle CRM.
Figure 4
Figure 4. Phylogenetic depth analysis of TFBSs in responding and non-responding regions using phyloP (46-way, hg19).
The x-axis grouping indicates the species used to calculate the phyloP scores. TFBSs were searched using all vertebrate profiles from the JASPAR CORE collection using the threshold of 0.8. TFs with at least 2-fold increase in phyloP scores (46wayAll) in the TFBS positions over the non-TFBS positions in the responding regions were identified. The score ratios for these TFs were compared among the three region sets. a) Average phyloP scores for the predicted TFBS positions and non-TFBS positions in each region set. b) Ratios of phyloP scores for the TFBS positions and non-TFBS positions in each region set.
Figure 5
Figure 5. Histone modifications in the responding and non-responding regions.
Proportion of the regions that overlap with ChIP-Seq peaks from Asp et al. are displayed. (MB = Myoblasts, MT = Myotubes).

Similar articles

Cited by

References

    1. Arnone MI, Davidson EH. The hardwiring of development: organization and function of genomic regulatory systems. Development. 1997;124:1851–1864. - PubMed
    1. Shimizu S, Miyamoto Y, Hayashi M. Cell-type dependency of two Foxa/HNF3 sites in the regulation of vitronectin promoter activity. Biochim Biophys Acta. 2002;1574:337–344. - PubMed
    1. McBride DJ, Kleinjan DA. Rounding up active cis-elements in the triple C corral: combining conservation, cleavage and conformation capture for the analysis of regulatory gene domains. Brief Funct Genomic Proteomic. 2004;3:267–279. - PubMed
    1. Ilnytska O, Sözen MA, Dauterive R, Argyropoulos G. Control elements in the neighboring ATPase gene influence spatiotemporal expression of the human agouti-related protein. J Mol Biol. 2009;388:239–251. - PMC - PubMed
    1. Ling J, Ainol L, Zhang L, Yu X, Pi W, et al. HS2 enhancer function is blocked by a transcriptional terminator inserted between the enhancer and the promoter. J Biol Chem. 2004;279:51704–51713. - PubMed

Publication types