. 2011 Dec;7(12):e1002276.
doi: 10.1371/journal.pcbi.1002276. Epub 2011 Dec 1.

BeadArray expression analysis using bioconductor

Affiliations

BeadArray expression analysis using bioconductor

Matthew E Ritchie et al. PLoS Comput Biol. 2011 Dec.

Abstract

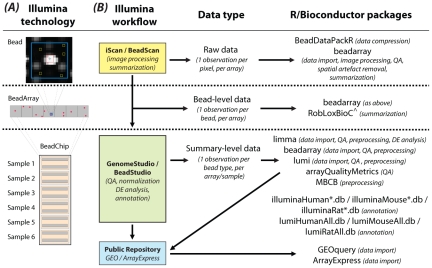
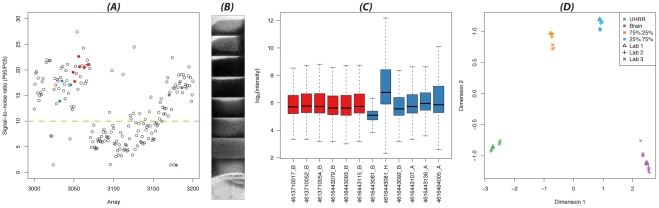
Illumina whole-genome expression BeadArrays are a popular choice in gene profiling studies. Aside from the vendor-provided software tools for analyzing BeadArray expression data (GenomeStudio/BeadStudio), there exists a comprehensive set of open-source analysis tools in the Bioconductor project, many of which have been tailored to exploit the unique properties of this platform. In this article, we explore a number of these software packages and demonstrate how to perform a complete analysis of BeadArray data in various formats. The key steps of importing data, performing quality assessments, preprocessing, and annotation in the common setting of assessing differential expression in designed experiments will be covered.


Conflict of interest statement

The authors have declared that no competing interests exist.

Figures

Figure 1
Figure 1. Overview of the technology and workflow.
(A) A zoomed view of a typical bead (top) with the pixels that contribute to the overall (red square) and local background (yellow squares) signals marked. Many replicate beads that contain the same 50-mer oligo are located on each BeadArray (middle) to ensure robust measures of expression can be obtained for each probe in a given sample. Around 48,000 different probe types are assayed in this way per sample. These BeadArrays come from a WG-6 BeadChip (bottom), which is made up of a total of 12 arrays, which are paired to allow transcript abundance to be measured in a total of six samples per BeadChip. (B) Summarizes the various data formats available along with the Illumina workflow associated with the different levels of data. Data can be in raw form, where pixel-level data are available from TIFF images, allowing the complete data processing pipeline, including image analysis, to be carried out in R. The next level, referred to as bead-level, refers to the availability of intensity and location information for individual beads. In this format, a given probe will have a variable number of replicate intensities per sample. Processed data, where replicate intensities have been summarized and outliers removed to give a mean, a measure of variability, and a number of observations per probe in each sample, is the most commonly available format. Summary data are usually obtained directly from Illumina's BeadStudio/GenomeStudio software, but can also be retrieved from public repositories such as GEO or ArrayExpress. The right-hand column of this figure indicates the R/Bioconductor packages that can handle data in these different formats. Probe annotation packages are also listed. List of abbreviations and footnotes used in this figure: QA, quality assessment; DE, differential expression; ∧, package available from CRAN ; *, denotes chip-specific part of package name that depends upon platform version (e.g., v1, v2, v3, v4).
Figure 2
Figure 2. Various diagnostic plots which are useful for quality assessment.
Where scanner metrics information is available, arrays within a particular experiment can be compared to each other, or to a wider set from the same core facility. In (A), a per array signal-to-noise value (95th percentile of signal divided by the 5th percentile) is plotted for 200 consecutive BeadArrays, with the arrays from the experiment in question highlighted in color (blue or red). Low signal-to-noise ratios indicate a poor dynamic range of intensities and can highlight problems with array processing when they occur sequentially over time. At the individual array level, sub-array artefacts can be detected using spatial plots of the intensities across the BeadArray surface (B) and removed using BASH and outlier removal. For a between sample display, boxplots of the intensities from different arrays within an experiment can highlight samples with unusual signal distributions (C). The relationships between different samples can also be assessed using a multi-dimensional scaling (MDS) plot (D), which can highlight true biological differences between samples (in this example, the difference between UHRR and Brain in dimension 1 and the pure versus mixed samples in dimension 2), as well as technical effects due to lab, experiment date, etc., which may also need to be accounted for in the modelling.

References

    1. Verdugo RA, Deschepper CF, Munoz G, Pomp D, Churchill GA. Importance of randomization in microarray experimental designs with Illumina platforms. Nucleic Acids Research. 2009;37:5610–5618. - PMC - PubMed
    1. Smyth GK, Yang Y, Speed TP. Statistical issues in cDNA microarray data analysis. Methods Mol Biol. 2003;224:111–136. - PubMed
    1. Allison DB, Cui X, Page GP, Sabripour M. Microarray data analysis: from disarray to consolidation and consensus. Nat Rev Genet. 2006;7:55–65. - PubMed
    1. Reimers M. Making informed choices about microarray data analysis. PLoS Comput Biol. 2010;6:e1000786. doi: 10.1371/journal.pcbi.1000786. - DOI - PMC - PubMed
    1. Gentleman RC, Carey VJ, Bates DM, Bolstad B, Dettling M, et al. Bioconductor: Open software development for computational biology and bioinformatics. Genome Biol. 2004;5:R80. - PMC - PubMed

Publication types

MeSH terms