

Modelling the spread of HIV immune escape mutants in a vaccinated population
- PMID: 22144883
- PMCID: PMC3228780
- DOI: 10.1371/journal.pcbi.1002289
Modelling the spread of HIV immune escape mutants in a vaccinated population
Abstract
Because cytotoxic T-lymphocytes (CTLs) have been shown to play a role in controlling human immunodeficiency virus (HIV) infection and because CTL-based simian immunodeficiency virus (SIV) vaccines have proved effective in non-human primates, one goal of HIV vaccine design is to elicit effective CTL responses in humans. Such a vaccine could improve viral control in patients who later become infected, thereby reducing onwards transmission and enhancing life expectancy in the absence of treatment. The ability of HIV to evolve mutations that evade CTLs and the ability of these 'escape mutants' to spread amongst the population poses a challenge to the development of an effective and robust vaccine. We present a mathematical model of within-host evolution and between-host transmission of CTL escape mutants amongst a population receiving a vaccine that elicits CTL responses to multiple epitopes. Within-host evolution at each epitope is represented by the outgrowth of escape mutants in hosts who restrict the epitope and their reversion in hosts who do not restrict the epitope. We use this model to investigate how the evolution and spread of escape mutants could affect the impact of a vaccine. We show that in the absence of escape, such a vaccine could markedly reduce the prevalence of both infection and disease in the population. However the impact of such a vaccine could be significantly abated by CTL escape mutants, especially if their selection in hosts who restrict the epitope is rapid and their reversion in hosts who do not restrict the epitope is slow. We also use the model to address whether a vaccine should span a broad or narrow range of CTL epitopes and target epitopes restricted by rare or common HLA types. We discuss the implications and limitations of our findings.
© 2011 Fryer, McLean.
Conflict of interest statement
The authors have declared that no competing interests exist.
Figures
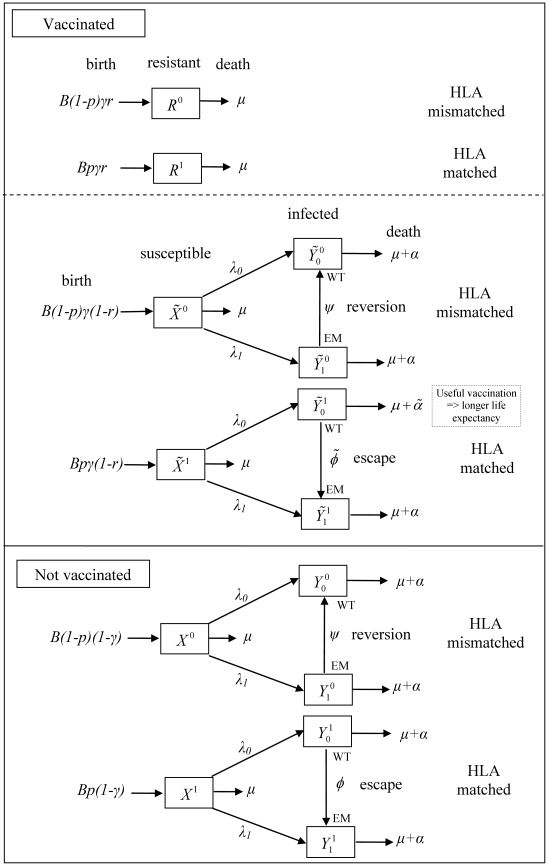
 in vaccinated hosts and rate
  in unvaccinated hosts. Reversion occurs at rate
  in both host types. Infected vaccinated hosts who are HLA matched for the vaccine epitope and who do not have an escape mutant at that epitope have a longer life expectancy compared to other infected hosts (
 ). Such individuals are also less infectious so make a smaller per capita contribution to the force of infection (
 ). Thus the force of infection for wildtype virus is defined as
  and for escape mutant virus is defined as
  .
.
 ,
, ,
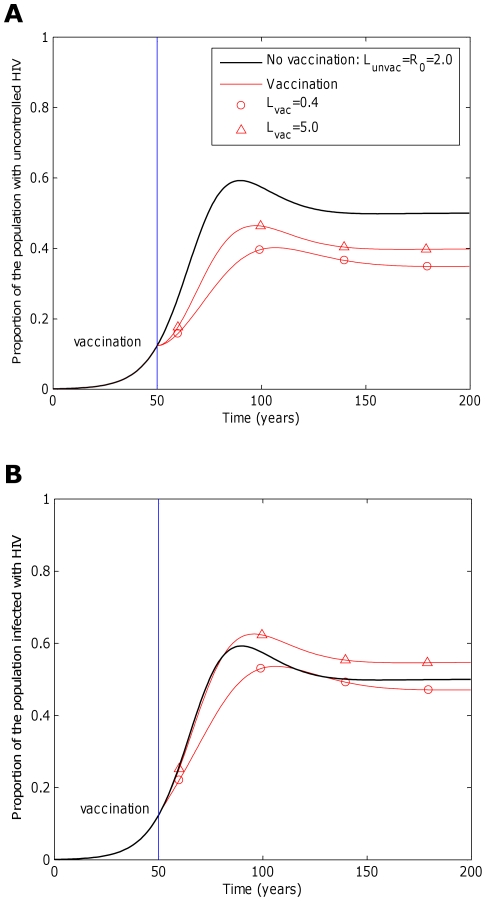
, years−1). One vaccine (circles, A and B) considerably reduces transmission probability by a factor of 25 (
 ), but restores life expectancy to its normal value (50 years;
  years−1). This vaccine reduces transmission potential by a factor of 5 (from
  to
to  ). The second example vaccine (triangles, A and B) causes a modest two fold reduction in transmission probability (
 ) and restores life expectancy to the its uninfected value (
 ). Thus, this vaccine more than doubles the transmission potential (
 ). In both cases the vaccine is administered to all unvaccinated hosts 50 years into the epidemic and to all newborns (γ = 1) thereafter, but provides no level of sterilizing immunity (r = 0). This figure shows that a vaccine that reduces the transmission potential (
 ) – i.e. suppresses infectiousness by a greater factor than it increases life expectancy – would reduce both the proportion of hosts with uncontrolled HIV (circles, A) and the proportion of hosts infected with HIV (circles, B). A vaccine that reduces transmission potential (
 ) would also decrease the proportion of hosts with uncontrolled HIV (triangles, A), but would marginally increase the proportion of hosts infected with HIV (triangles, B). For these figures we assume that the vaccine elicits responses to five CTL epitopes. At each epitope escape in HLA matched hosts escape takes an average 8 years following infection (
 years−1 for i = 1∶5). Reversion in HLA mismatched hosts takes an average of 36 years at each epitope (
 years−1 for i = 1∶5). We also assume that at the start of the epidemic 0.1% of the population are infected and that all of these hosts are infected with the wildytype strain.
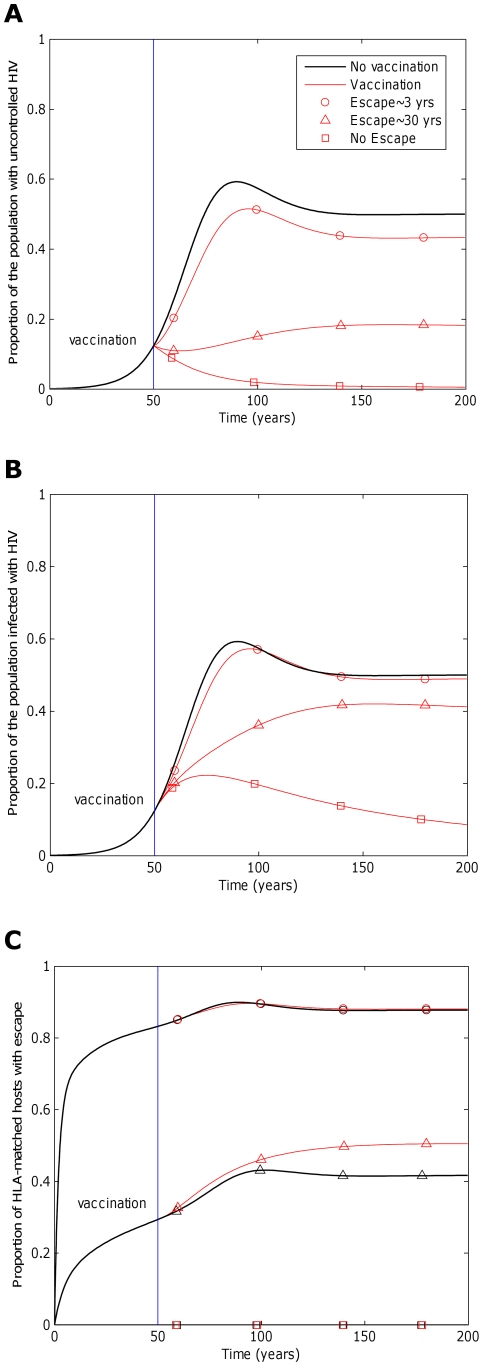
 ) 50 years into an epidemic. Three different escape rates are considered: rapid escape (circles
  years−1 for i = 1∶5), slow escape (triangles;
  years−1 for i = 1∶5) and no escape (squares;
  years−1 for i = 1∶5) at each epitope. In each example, escape occurs at the same rate in vaccinated and unvaccinated hosts (
 for i = 1∶5). Reversion takes an average of 36 years at each epitope in both vaccinated an unvaccinated hosts (
 years−1 for i = 1∶5). A) shows the proportion of hosts with uncontrolled HIV. B) shows the proportion of hosts infected with HIV. C) shows the escape prevalence amongst HLA-matched hosts. The impact of vaccination (red lines) is compared to the scenario where vaccination is absent (black lines). This figure shows that the prevalence of escape amongst HLA-matched hosts at each epitope would be lower (C) and the vaccine would be more effective in reducing the prevalence of uncontrolled HIV (A) and HIV infection (B) if the rate of escape were slower. The assumptions and parameters used in these figures are the same as those described for Figure 2 except that the infectiousness and life expectancy of successfully vaccinated hosts are fixed at
  and
and  , respectively (
 ). Note that in this figure and the remaining figures, different markers (e.g. circles, triangles and squares) are used to distinguish between different model outputs. These do not represent data.
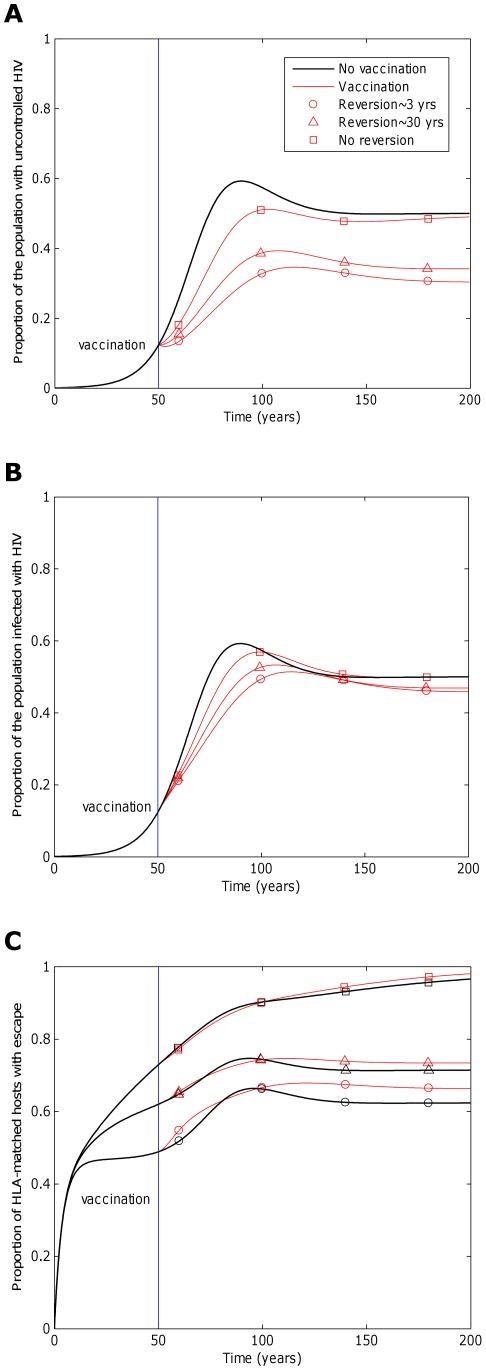
 years−1 for i = 1∶5), slow reversion (triangles;
  years−1 for i = 1∶5) and no reversion (squares;
  years−1 for i = 1∶5) at each epitope in both vaccinated and unvaccinated hosts. Escape takes an average of 8 years at each epitope in both vaccinated an unvaccinated hosts (
 years−1 for i = 1∶5). A) shows the proportion of hosts with uncontrolled HIV. B) shows the proportion of hosts infected with HIV. C) shows the escape prevalence amongst HLA-matched hosts. The impact of vaccination (red lines) is compared to the scenario where vaccination is absent (black lines). This figure shows that the prevalence of escape amongst HLA-matched hosts at each epitope would be lower (C) and the vaccine would be more effective in reducing the prevalence of uncontrolled HIV (A) and HIV infection (B) if immune escape mutants revert more rapidly in HLA mismatched hosts. The assumptions and parameters used in these figures are the same as those described for Figure 2 except that the infectiousness and life expectancy of successfully vaccinated hosts are fixed at
  and
and  , respectively (
 ).
).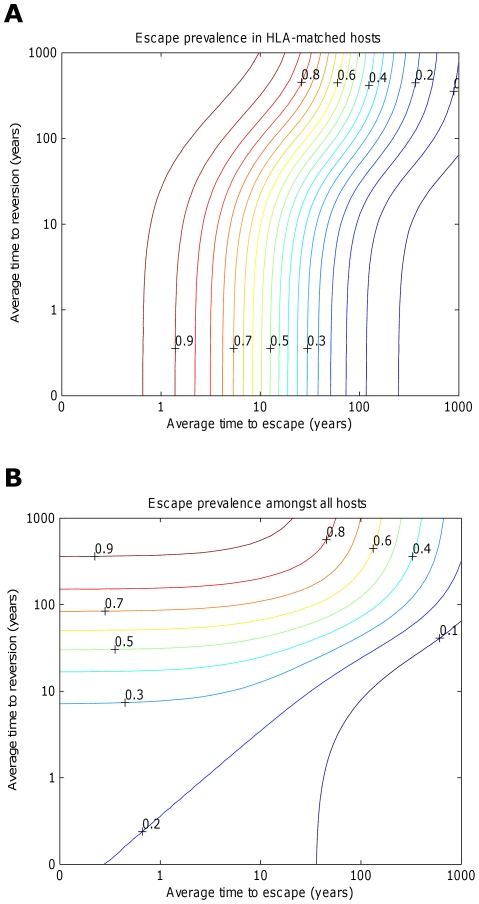
 for i = 1∶5). The escape and reversion rates are presented in terms their reciprocal – the average time to escape (x-axis) and average time to reversion (y-axis). The contours show that the prevalence of escape amongst A) HLA-matched hosts and B) all hosts increases as the rate of escape increases and the rate of reversion decreases; however, the increase in escape prevalence in HLA-matched hosts with reversion rate is limited when revision takes an average of 10 years or less. The assumptions and parameters used in these figures are the same as those described for Figure 2 except that the infectiousness and life expectancy of successfully vaccinated hosts are fixed at
  and
and  , respectively (
 ).
).
 years−1 for i = 1∶5). Reversion takes an average of 36 years at each epitope in both vaccinated an unvaccinated hosts (
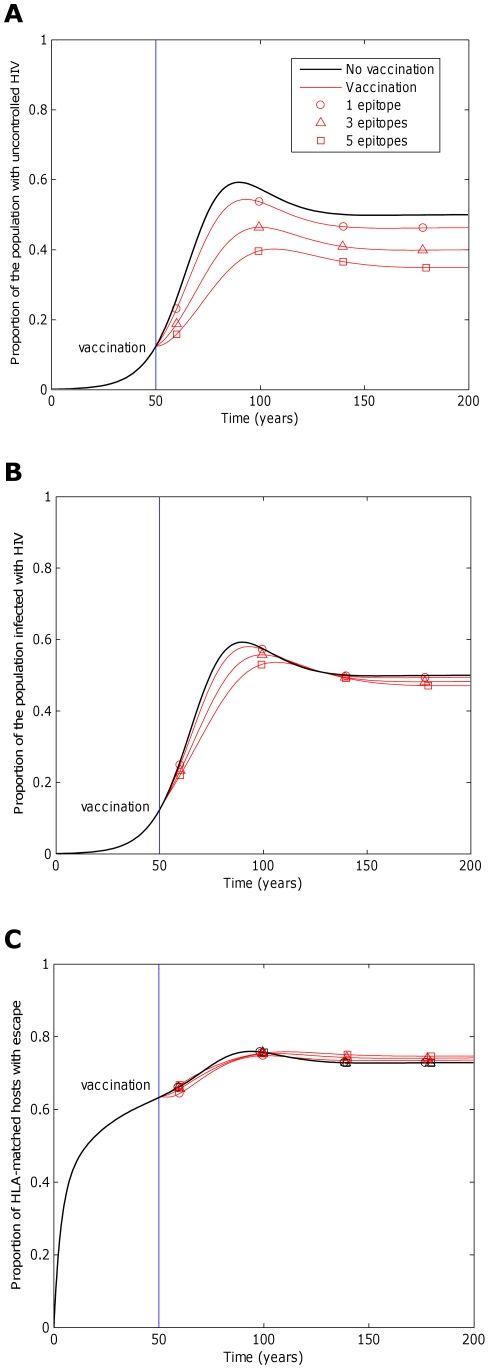
 years−1 for i = 1∶5). A) shows the proportion of hosts with uncontrolled HIV. B) shows the proportion of hosts infected with HIV. C) shows the escape prevalence amongst HLA-matched hosts. The impact of vaccination (red lines) is compared to the scenario where vaccination is absent (black lines). C) shows that the prevalence of escape at each epitope in HLA-matched hosts would be relatively invariant to the number of epitopes included in the vaccine. Two conflicting forces that result from the increase in protection offered by additional epitopes affect this prevalence. More protection means that hosts live longer so have more time to select escape mutants, but also means that hosts are less infectious, so are less likely to transmit mutants to other hosts. Despite the lack of variation of escape prevalence (at each epitope) with vaccine breadth, vaccines that elicit broader responses would be markedly more effective at reducing disease (A) because they would ensure that more hosts have the potential to recognise at least one epitope and more hosts remain protected by alternative responses if escape occurs in one epitope. Infection prevalence would also reduce with increased vaccine breadth (B), but to a lesser extent. The assumptions and parameters used in these figures are the same as those described for Figure 2, except that the infectiousness and life expectancy of successfully vaccinated hosts are fixed at
  and
and  , respectively (
 ).
).
 years−1 for i = 1∶5). Reversion takes an average of 36 years at each epitope in both vaccinated an unvaccinated hosts (
 years−1 for i = 1∶5). A) shows the proportion of hosts with uncontrolled HIV. B) shows the proportion of hosts infected with HIV. C) shows the escape prevalence amongst HLA-matched hosts. The impact of vaccination (red lines) is compared to the scenario where vaccination is absent (black lines). C) reveals that the prevalence of escape amongst HLA-matched hosts at each epitope would be higher if the restricting HLA is more prevalent. However, escape prevalence is not the only factor which contributes to vaccine impact since epitopes restricted by more prevalent HLAs will also provide protection to a greater fraction of the population. A) and B) reveal that an intermediate HLA prevalence (30% in this example, triangles) can optimise vaccine impact. This result is demonstrated more explicitly in panel D) in which the prevalence of uncontrolled infection for the single-epitope version of the model 200 years into an epidemic is used to explore the effect of HLA prevalence upon vaccine impact . D) shows that uncontrolled infection prevalence is a u-shaped function of the restricting HLA prevalence, thus is minimised at intermediate HLA prevalences. In this example (
 year−1 and
  years−1) vaccine impact is optimised when 32% of the population are HLA matched for the epitope. E) shows that the HLA prevalence that maximises vaccine impact 200 years into an epidemic is dependent upon the rate of escape in HLA matched hosts (
 ) and rates of reversion in HLA mismatched hosts (
 ). The assumptions and parameters used in these figure are the same as those described for Figure 2, except that the infectiousness and life expectancy of successfully vaccinated hosts are fixed at
  and
and  , respectively (
 ).
).References
-
- Flynn NM, Forthal DN, Harro CD, Judson FN, Mayer KH, et al. Placebo-controlled phase 3 trial of a recombinant glycoprotein 120 vaccine to prevent HIV-1 infection. J Infect Dis. 2005;191:654–665. - PubMed
-
- Burton DR, Desrosiers RC, Doms RW, Koff WC, Kwong PD, et al. HIV vaccine design and the neutralizing antibody problem. Nat Immunol. 2004;5:233–236. - PubMed
-
- Karlsson Hedestam GB, Fouchier RA, Phogat S, Burton DR, Sodroski J, et al. The challenges of eliciting neutralizing antibodies to HIV-1 and to influenza virus. Nat Rev Microbiol. 2008;6:143–155. - PubMed
Publication types
MeSH terms
Substances
Grants and funding
LinkOut - more resources
Full Text Sources
Medical
Research Materials
