

A temporal role of type I interferon signaling in CD8+ T cell maturation during acute West Nile virus infection
- PMID: 22144897
- PMCID: PMC3228803
- DOI: 10.1371/journal.ppat.1002407
A temporal role of type I interferon signaling in CD8+ T cell maturation during acute West Nile virus infection
Abstract
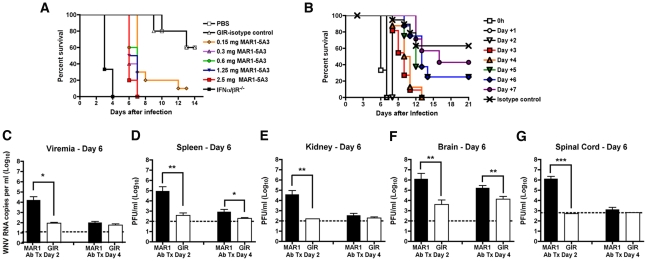
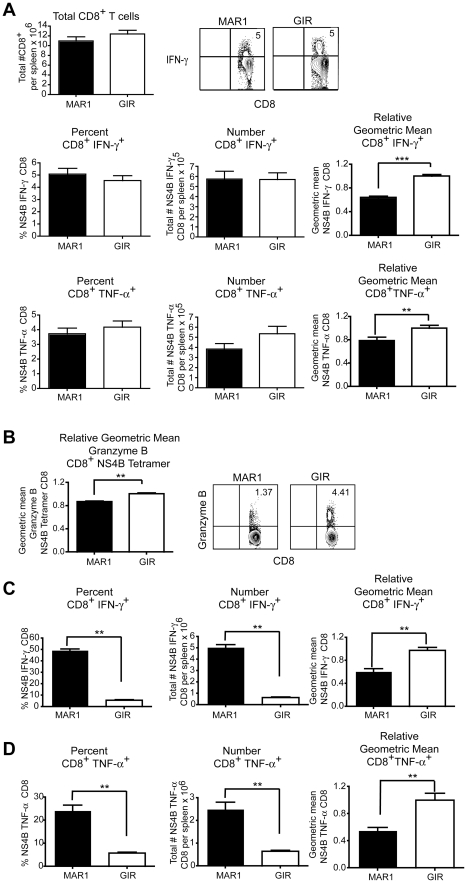
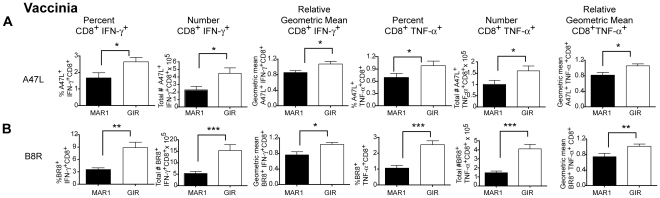
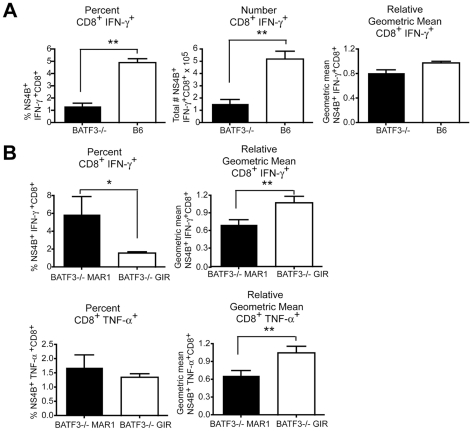
A genetic absence of the common IFN-α/β signaling receptor (IFNAR) in mice is associated with enhanced viral replication and altered adaptive immune responses. However, analysis of IFNAR(-/-) mice is limited for studying the functions of type I IFN at discrete stages of viral infection. To define the temporal functions of type I IFN signaling in the context of infection by West Nile virus (WNV), we treated mice with MAR1-5A3, a neutralizing, non cell-depleting anti-IFNAR antibody. Inhibition of type I IFN signaling at or before day 2 after infection was associated with markedly enhanced viral burden, whereas treatment at day 4 had substantially less effect on WNV dissemination. While antibody treatment prior to infection resulted in massive expansion of virus-specific CD8(+) T cells, blockade of type I IFN signaling starting at day 4 induced dysfunctional CD8(+) T cells with depressed cytokine responses and expression of phenotypic markers suggesting exhaustion. Thus, only the later maturation phase of anti-WNV CD8(+) T cell development requires type I IFN signaling. WNV infection experiments in BATF3(-/-) mice, which lack CD8-α dendritic cells and have impaired priming due to inefficient antigen cross-presentation, revealed a similar effect of blocking IFN signaling on CD8(+) T cell maturation. Collectively, our results suggest that cell non-autonomous type I IFN signaling shapes maturation of antiviral CD8(+) T cell response at a stage distinct from the initial priming event.
Conflict of interest statement
The authors have declared that no competing interests exist.
Figures
Similar articles
-
A systems biology approach reveals that tissue tropism to West Nile virus is regulated by antiviral genes and innate immune cellular processes.PLoS Pathog. 2013 Feb;9(2):e1003168. doi: 10.1371/journal.ppat.1003168. Epub 2013 Feb 7. PLoS Pathog. 2013. PMID: 23544010 Free PMC article.
-
West Nile Virus Infection Blocks Inflammatory Response and T Cell Costimulatory Capacity of Human Monocyte-Derived Dendritic Cells.J Virol. 2019 Nov 13;93(23):e00664-19. doi: 10.1128/JVI.00664-19. Print 2019 Dec 1. J Virol. 2019. PMID: 31534040 Free PMC article.
-
IRF9 Prevents CD8+ T Cell Exhaustion in an Extrinsic Manner during Acute Lymphocytic Choriomeningitis Virus Infection.J Virol. 2017 Oct 27;91(22):e01219-17. doi: 10.1128/JVI.01219-17. Print 2017 Nov 15. J Virol. 2017. PMID: 28878077 Free PMC article.
-
The innate immune adaptor molecule MyD88 restricts West Nile virus replication and spread in neurons of the central nervous system.J Virol. 2010 Dec;84(23):12125-38. doi: 10.1128/JVI.01026-10. Epub 2010 Sep 29. J Virol. 2010. PMID: 20881045 Free PMC article.
-
Structure, function, and immunomodulation of the CD8 co-receptor.Front Immunol. 2024 Aug 26;15:1412513. doi: 10.3389/fimmu.2024.1412513. eCollection 2024. Front Immunol. 2024. PMID: 39253084 Free PMC article. Review.
Cited by
-
A systems biology approach reveals that tissue tropism to West Nile virus is regulated by antiviral genes and innate immune cellular processes.PLoS Pathog. 2013 Feb;9(2):e1003168. doi: 10.1371/journal.ppat.1003168. Epub 2013 Feb 7. PLoS Pathog. 2013. PMID: 23544010 Free PMC article.
-
Membrane-proximal motifs encode differences in signaling strength between type I and III interferon receptors.Sci Signal. 2023 Oct 10;16(806):eadf5494. doi: 10.1126/scisignal.adf5494. Epub 2023 Oct 10. Sci Signal. 2023. PMID: 37816090 Free PMC article.
-
Activation of RNase L by Murine Coronavirus in Myeloid Cells Is Dependent on Basal Oas Gene Expression and Independent of Virus-Induced Interferon.J Virol. 2016 Jan 6;90(6):3160-72. doi: 10.1128/JVI.03036-15. J Virol. 2016. PMID: 26739051 Free PMC article.
-
Complementary diversification of dendritic cells and innate lymphoid cells.Curr Opin Immunol. 2014 Aug;29:69-78. doi: 10.1016/j.coi.2014.04.006. Epub 2014 May 27. Curr Opin Immunol. 2014. PMID: 24874447 Free PMC article. Review.
-
Klf4 expression in conventional dendritic cells is required for T helper 2 cell responses.Immunity. 2015 May 19;42(5):916-28. doi: 10.1016/j.immuni.2015.04.017. Immunity. 2015. PMID: 25992862 Free PMC article.
References
-
- Isaacs A, Lindenmann J. Virus interference. I. The interferon. Proc R Soc Lond B Biol Sci. 1957;147:258–267. - PubMed
-
- Stark GR, Kerr IM, Williams BR, Silverman RH, Schreiber RD. How cells respond to interferons. Annu Rev Biochem. 1998;67:227–264. - PubMed
-
- Colonna M, Trinchieri G, Liu YJ. Plasmacytoid dendritic cells in immunity. Nat Immunol. 2004;5:1219–1226. - PubMed
Publication types
MeSH terms
Substances
Grants and funding
LinkOut - more resources
Full Text Sources
Other Literature Sources
Medical
Molecular Biology Databases
Research Materials
