

Integrating genome-wide genetic variations and monocyte expression data reveals trans-regulated gene modules in humans
- PMID: 22144904
- PMCID: PMC3228821
- DOI: 10.1371/journal.pgen.1002367
Integrating genome-wide genetic variations and monocyte expression data reveals trans-regulated gene modules in humans
Abstract
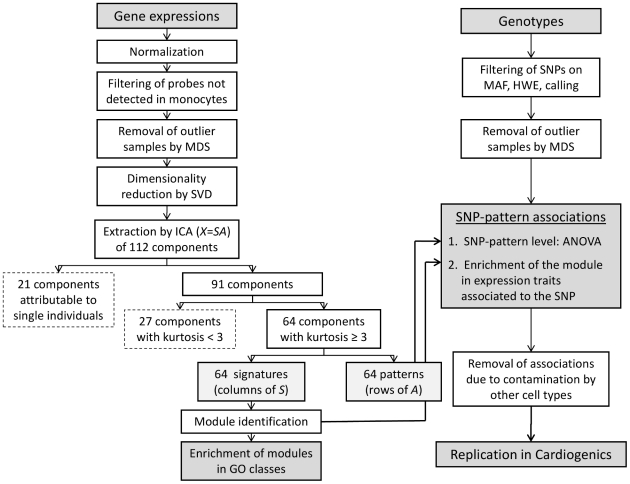
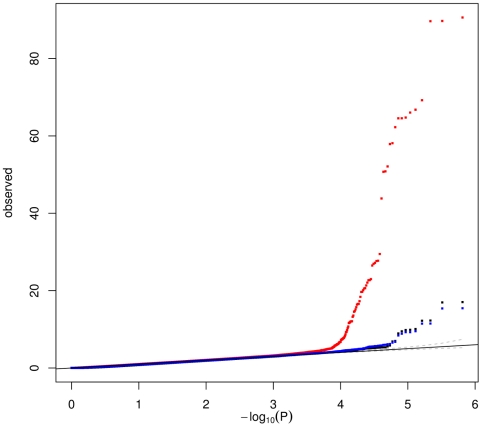
One major expectation from the transcriptome in humans is to characterize the biological basis of associations identified by genome-wide association studies. So far, few cis expression quantitative trait loci (eQTLs) have been reliably related to disease susceptibility. Trans-regulating mechanisms may play a more prominent role in disease susceptibility. We analyzed 12,808 genes detected in at least 5% of circulating monocyte samples from a population-based sample of 1,490 European unrelated subjects. We applied a method of extraction of expression patterns-independent component analysis-to identify sets of co-regulated genes. These patterns were then related to 675,350 SNPs to identify major trans-acting regulators. We detected three genomic regions significantly associated with co-regulated gene modules. Association of these loci with multiple expression traits was replicated in Cardiogenics, an independent study in which expression profiles of monocytes were available in 758 subjects. The locus 12q13 (lead SNP rs11171739), previously identified as a type 1 diabetes locus, was associated with a pattern including two cis eQTLs, RPS26 and SUOX, and 5 trans eQTLs, one of which (MADCAM1) is a potential candidate for mediating T1D susceptibility. The locus 12q24 (lead SNP rs653178), which has demonstrated extensive disease pleiotropy, including type 1 diabetes, hypertension, and celiac disease, was associated to a pattern strongly correlating to blood pressure level. The strongest trans eQTL in this pattern was CRIP1, a known marker of cellular proliferation in cancer. The locus 12q15 (lead SNP rs11177644) was associated with a pattern driven by two cis eQTLs, LYZ and YEATS4, and including 34 trans eQTLs, several of them tumor-related genes. This study shows that a method exploiting the structure of co-expressions among genes can help identify genomic regions involved in trans regulation of sets of genes and can provide clues for understanding the mechanisms linking genome-wide association loci to disease.
Conflict of interest statement
The authors have declared that no competing interests exist.
Figures


References
-
- Goring HH, Curran JE, Johnson MP, Dyer TD, Charlesworth J, et al. Discovery of expression QTLs using large-scale transcriptional profiling in human lymphocytes. Nat Genet. 2007;39:1208–1216. - PubMed
-
- Dixon AL, Liang L, Moffatt MF, Chen W, Heath S, et al. A genome-wide association study of global gene expression. Nat Genet. 2007;39:1202–1207. - PubMed
Publication types
MeSH terms
Substances
Grants and funding
LinkOut - more resources
Full Text Sources
Other Literature Sources
Medical
Miscellaneous
