. 2011 Dec;7(12):e1002386.
doi: 10.1371/journal.pgen.1002386. Epub 2011 Dec 1.

Genome instability and transcription elongation impairment in human cells depleted of THO/TREX

Affiliations

Genome instability and transcription elongation impairment in human cells depleted of THO/TREX

María S Domínguez-Sánchez et al. PLoS Genet. 2011 Dec.

Abstract

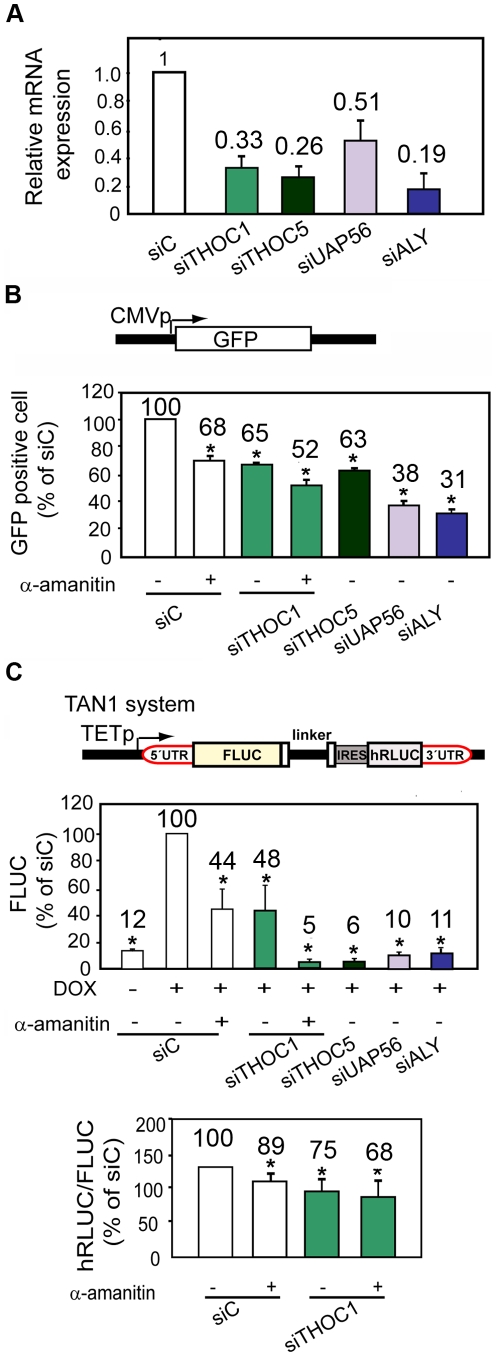
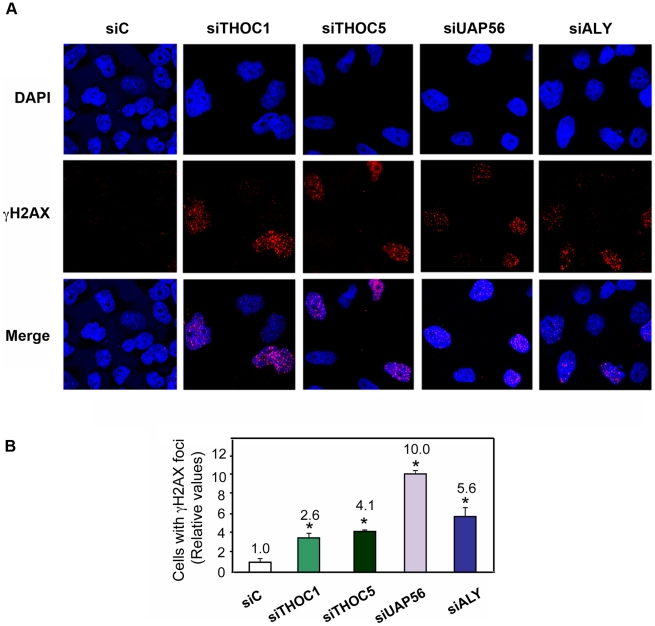
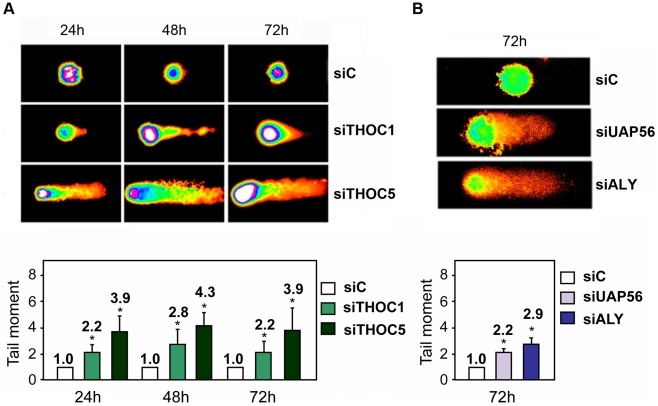
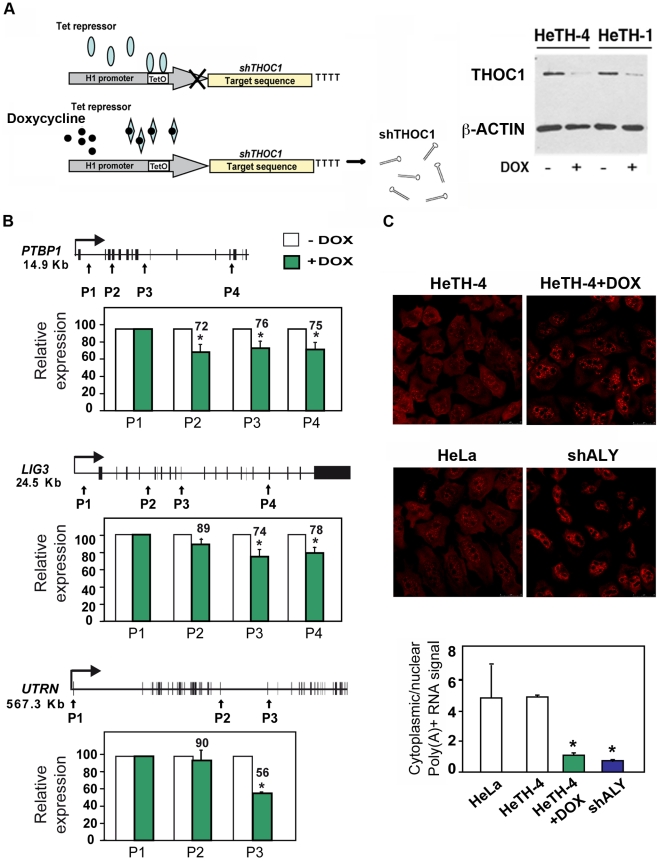
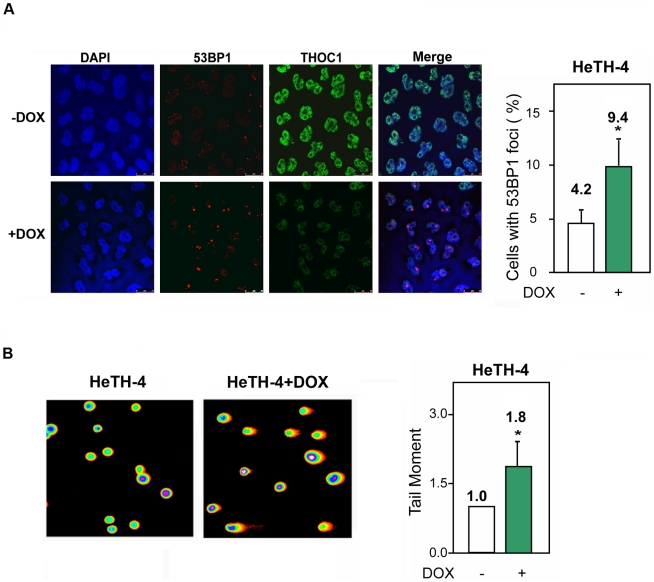
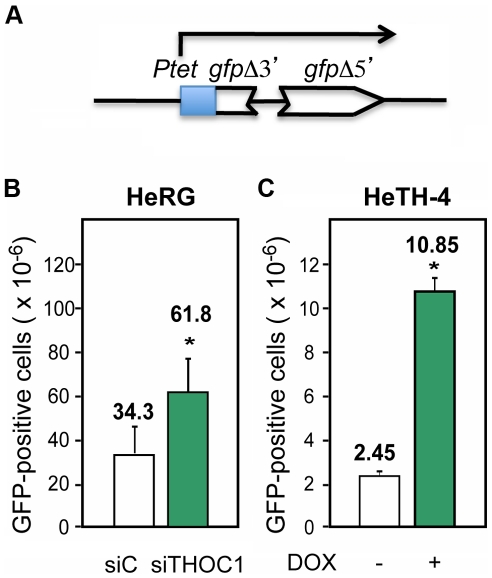
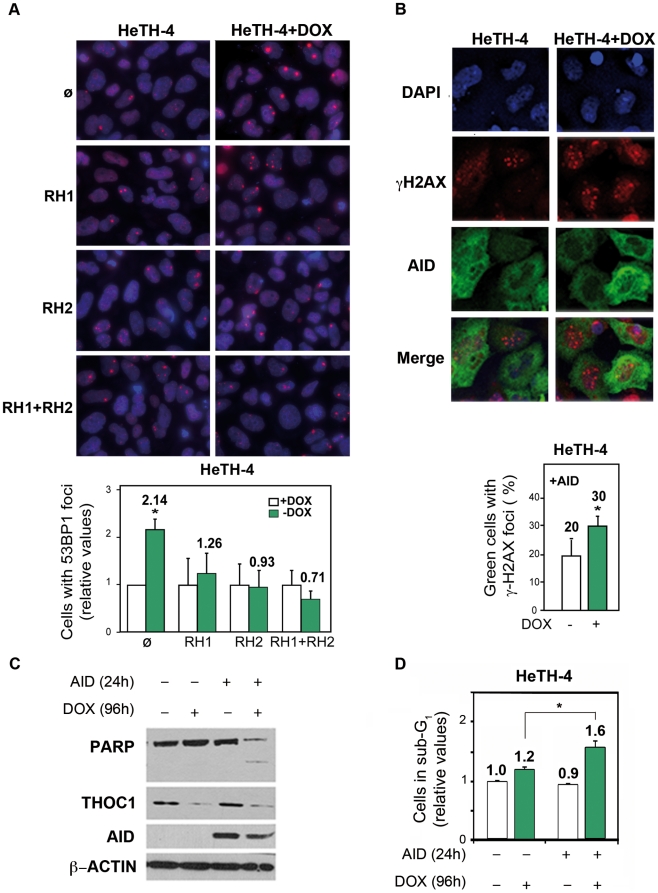
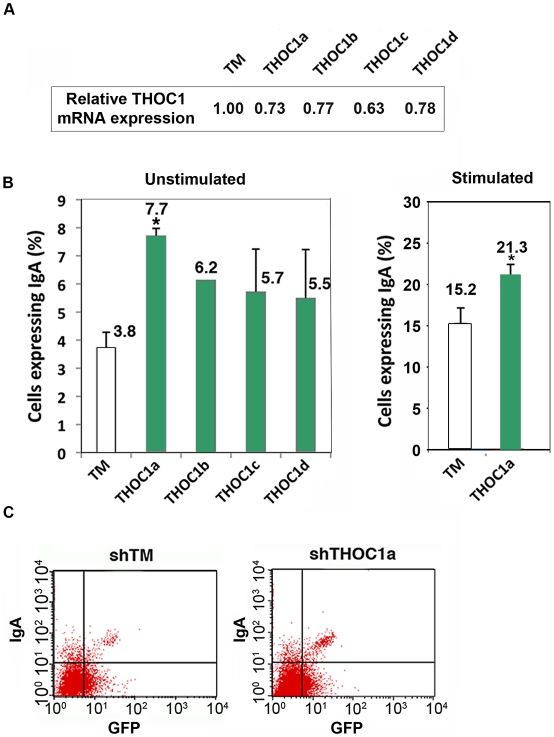
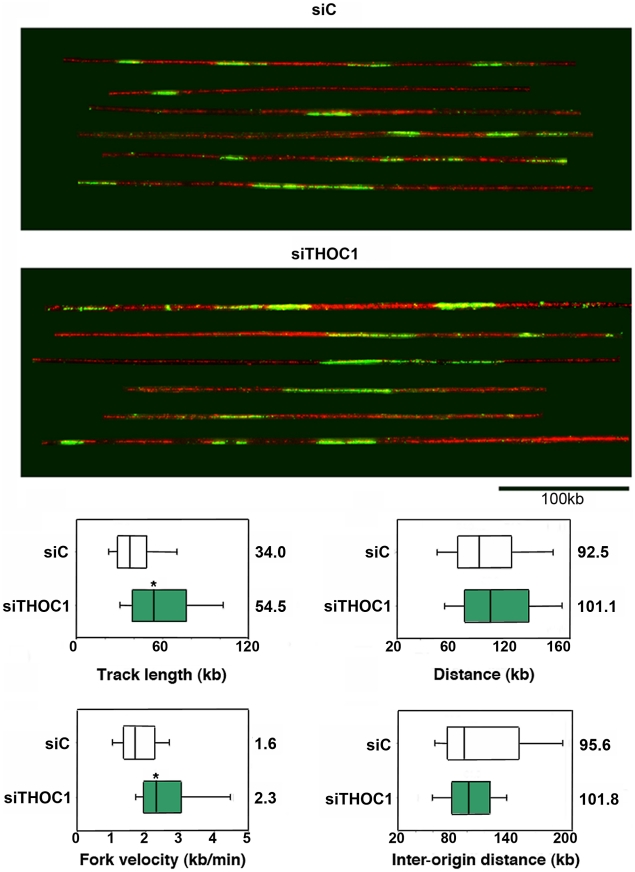
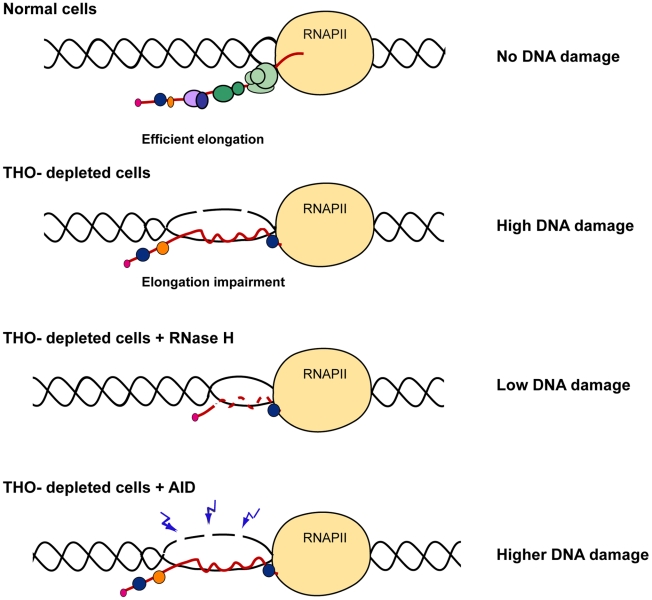
THO/TREX connects transcription with genome integrity in yeast, but a role of mammalian THO in these processes is uncertain, which suggests a differential implication of mRNP biogenesis factors in genome integrity in yeast and humans. We show that human THO depletion impairs transcription elongation and mRNA export and increases instability associated with DNA breaks, leading to hyper-recombination and γH2AX and 53BP1 foci accumulation. This is accompanied by replication alteration as determined by DNA combing. Genome instability is R-loop-dependent, as deduced from the ability of the AID enzyme to increase DNA damage and of RNaseH to reduce it, or from the enhancement of R-loop-dependent class-switching caused by THOC1-depletion in CH12 murine cells. Therefore, mammalian THO prevents R-loop formation and has a role in genome dynamics and function consistent with an evolutionary conservation of the functional connection between these mRNP biogenesis factors and genome integrity that had not been anticipated.


Conflict of interest statement

The authors have declared that no competing interests exist.

Figures

Figure 1
Figure 1. THO/TREX depletion impairs transcription elongation.
A) Relative expression of THO/TREX components. mRNA levels were measured by RT-qPCR 96 h after siRNA depletion. B) GFP expression determined by FACS analysis after 96 h of depletion with siRNAs (hHpr1/THOC1, THOC5, UAP56 and ALY), performed 24 h after transfection with the pmaxGFP vector containing CMVp::GFP. α-amanitin (2 µg/ml) was used as a positive control of transcription inhibition. A scheme of the pmaxGFP reporter carrying a CMVp::GFP fusion is shown on top. C) Transcription elongation determined with TAN system. Scheme of the tandem reporter system TAN1 used for transcription elongation. A tetracycline-regulated promoter (TETp) drives transcription through the FLUC and hRLUC tandem reporters. An internal ribosome entry sequence (IRES) enhances translation of the uncapped hRLUC expression fragment by replacing the requirement for the 5′ cap and untranslated region (5′ UTR). FLUC expression determined by luminometer analysis with TAN1 is shown. hRLUC∶FLUC activity ratios are plotted for the indicated 96 h siRNA depleted cells. For this, 72 h after siRNA transfection, cells were transfected with TAN1, transcription was activated with doxycycline, and 24 hours later, cells were harvested. Results are expressed as a percentage of the siRNA control (siC). Average and standard error from three independent experiments are shown. When the P value of the difference with the siC control calculated with the Student's t test is <0.05, it is indicated with an asterisk (*).
Figure 2
Figure 2. THO/TREX depletion increases cellular DNA damage response.
A) Immunofluorescence of γH2AX after transfection with the indicated siRNAs. Time-course experiments were performed. The time point where the maximum γH2AX foci containing cells were observed for each depletion is shown (48 h for siTHOC1 and siTHOC5, and 72 h for siUAP56 and siALY). Nuclei were stained with DAPI. B) Quantification of γH2AX after siRNA depletion is shown. . Average and standard error from three independent experiments are shown (more than 100 cells were analyzed per siRNA transfection). When the P value of the difference with the siC control calculated with the Mann & Whitney test is <0.05, it is indicated with an asterisk (*).
Figure 3
Figure 3. THO/TREX depletion leads to an increase in DNA breaks.
A) Quantification of DNA breaks at sequential time points after transfection with siTHOC1 and siTHOC5 siRNAs assessed by the alkaline comet assay. B) Comet assay 72 h after transfection with siUAP56 and siALY siRNAs. At least 50 cells were counted per group to calculate the median of the tail moment. Average and standard error from three independent experiments are shown. When the P value of the difference with the siC control calculated with the Mann & Whitney test is <0.05, it is indicated with an asterisk (*).
Figure 4
Figure 4. Gene expression defects in stable cell lines depleted of THOC1.
A) Immunoblot showing THOC1 expression in HeLa stable cell lines with an inducible shTHOC1 (HeTH cells) with (+DOX) or without doxycycline (−DOX). A scheme of the system used to induce THOC1 shRNA expression is shown. B) Effect of THOC1 depletion in transcription elongation of endogenous genes (PTBP1, LIG3 and UTRN) as determined by RT-qPCR. The relative amount of nascent mRNA in HeTH-4 cells is plotted. C) Nucleocytoplasmic polyA+ RNA distribution in HeLa-derived HeTH-4 cells in which THOC1 depletion was induced with doxycycline and HeLa cells transiently transfected with the indicated shRNAs. More than 50 cells per group were subjected to in situ hybridization with Cy3-oligo dT50 probe. Scale bar refers to 25 µm. Ratio of cytoplasmic and nuclear signals as quantified in each knockdown cell is represented below. Average and standard error of 3 independent experiments are shown. When the P value of the difference with the siC control calculated with the Student's t test (for results shown in B) or the Annova-Newman and Keuls (for results shown in C) is statistically significant it is indicated with an asterisk (* for P<0.05).
Figure 5
Figure 5. Genome instability in stable cell lines depleted of THOC1.
A) 53BP1 foci formation in HeTH-4 cells (−DOX) and HeTH-4 cells depleted of THOC1 (+DOX). Immunofluorescence of THOC1 and 53BP1 are depicted. Nuclei were stained with DAPI. The percentage of cells with 53BP1 foci in the presence (−DOX) or absence (+DOX) of THOC1 is plotted. B) DNA breaks measured by the Comet assay in HeTH-4 cells with or without doxycycline. The graph shows the increase in the tail moment as indicative of DNA breaks occurring after THOC1 depletion. Average and SE from three independent experiments are shown (number of cells analyzed as in Figure 2 and Figure 3). When the P value of the difference with the control calculated with the Mann & Whitney test is <0.05, it is indicated with an asterisk (*).
Figure 6
Figure 6. Recombination is increased after THOC1 depletion.
A) Scheme of the pIREC direct-repeat recombination construct used to generate stable HeLa cell lines. B) Recombination analysis using the HeRG stable cell line depleted of THOC1 by siRNA. C) Recombination analysis in the HeTH-4 stable cell lines (−DOX and +DOX) transfected with the plasmid pIREC-direct repeat containing vector. The recombination frequency was measured by FACs analysis as GFP positive cells, 96 h after transfection (B and C). Average and SE from three independent experiments are shown. When the P value of the difference with the siC control calculated with the Mann & Whitney test is <0.05, it is indicated with an asterisk (*).
Figure 7
Figure 7. Genome instability in THOC1 is mediated by R-loop formation.
A) Suppression of the increase in the number of cells with 53BP1 foci in HeTH-4 cells (+DOX) by RNaseH overexpression. Cells were transfected with pcDNA3 (ø), pcDNA3-RNaseH1 (RH1) and/or pcDNA3-RNaseH2 (RH2). Merge images of DAPI nuclei stained and 53BP1 immunofluorescence are shown. B) Immunofluorescence of γH2AX and AID pictures are depicted. Nuclei were stained with DAPI. Graph shows the increase in the percentage of cells with foci in the condition of THOC1 depletion and AID expression. Average and SE from three independent experiments are shown (more than 100 cells were analysed per group). C) Analysis of the effect of AID expression on apoptosis in THOC1-depleted cells as determined by Immunoblot of HeTH-4 cell extracts using anti-PARP antibody. D) Analysis of the effect of AID on apoptosis in THOC1-depleted cells as determined by FACS analysis of cell displaying subG1-DNA content. Average and SE from three independent experiments are shown. When the P value of the difference with the control calculated with the Mann & Whitney test is <0.05, it is indicated with an asterisk (*).
Figure 8
Figure 8. Depletion of THOC1 in CH12 murine B cell line enhances class switch recombination.
CH12 cells were transfected with a pSUPER vector containing GFP and the indicated shRNA (lower case letters indicate shRNAs against different gene exons). A) Relative THOC1 mRNA levels. B) IgA expression was measured 72 h after transfection in GFP positive cells by FACs in unstimulated and stimulated cells (treated with cytokines for 12 h, as detailed in Material and Methods). When the P value of the difference with the control calculated with the Mann & Whitney test is <0.05, it is indicated with an asterisk (*). C) A representative graph of the FACs experiments.
Figure 9
Figure 9. Combing assay showing that replication fork progression is altered in cells depleted of THOC1.
Single-molecule analysis of DNA replication. siC (control) and siTHOC1 transfected HeLa cells were pulse-labeled for 20 min with CldU and fibres were stretched by DNA combing. Red: DNA, Green: CldU. Bar: 100 kb. Distribution of CldU tracks length in HeLa cells. Box: 25–75 percentile range. Whiskers: 10–90 percentile range. Medians are indicated in kb. Distribution of centre-to-centre distances between CldU tracks, replication fork velocity and inter-origin distance in HeLa cells transfected with siC and siTHOC1 siRNAs are shown. When the P value of the difference with the siC control calculated with the Median test is <0.05, it is indicated with an asterisk (*).
Figure 10
Figure 10. Model to explain the role of THO/TREX in the prevention of R-loop formation.
THO/TREX contributes to the co-transcriptional formation of an optimal mRNP particle preventing hybridization of the nascent mRNA with the DNA template and formation of an R-loop. In THO-depleted human cells, R-loops are formed leading to a single-stranded DNA that is more susceptible to be damaged spontaneously by genotoxic agents or by AID. R-loop removal by RNase H over-expression would alleviate DNA damage and genome instability caused by THO depletion.

Similar articles

Cited by

References

    1. Bentley DL. Rules of engagement: co-transcriptional recruitment of pre-mRNA processing factors. Curr Opin Cell Biol. 2005;17:251–256. - PubMed
    1. Luna R, Gaillard H, Gonzalez-Aguilera C, Aguilera A. Biogenesis of mRNPs: integrating different processes in the eukaryotic nucleus. Chromosoma. 2008;117:319–331. - PubMed
    1. Chavez S, Beilharz T, Rondon AG, Erdjument-Bromage H, Tempst P, et al. A protein complex containing Tho2, Hpr1, Mft1 and a novel protein, Thp2, connects transcription elongation with mitotic recombination in Saccharomyces cerevisiae. EMBO J. 2000;19:5824–5834. - PMC - PubMed
    1. Strasser K, Masuda S, Mason P, Pfannstiel J, Oppizzi M, et al. TREX is a conserved complex coupling transcription with messenger RNA export. Nature. 2002;417:304–308. - PubMed
    1. Voynov V, Verstrepen KJ, Jansen A, Runner VM, Buratowski S, et al. Genes with internal repeats require the THO complex for transcription. Proc Natl Acad Sci U S A. 2006;103:14423–14428. - PMC - PubMed

Publication types

MeSH terms