. 2011 Dec;7(12):e1002396.
doi: 10.1371/journal.pgen.1002396. Epub 2011 Dec 1.

Targeted proteolysis of plectin isoform 1a accounts for hemidesmosome dysfunction in mice mimicking the dominant skin blistering disease EBS-Ogna

Affiliations

Targeted proteolysis of plectin isoform 1a accounts for hemidesmosome dysfunction in mice mimicking the dominant skin blistering disease EBS-Ogna

Gernot Walko et al. PLoS Genet. 2011 Dec.

Abstract

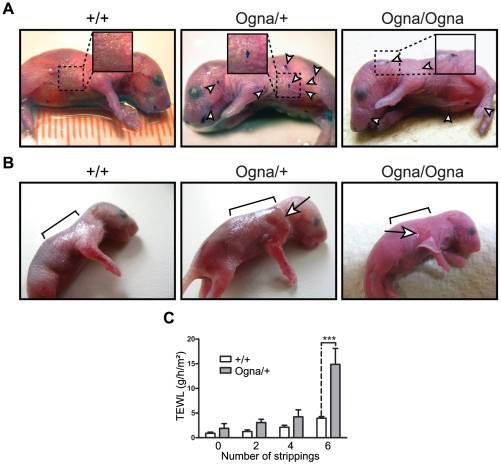
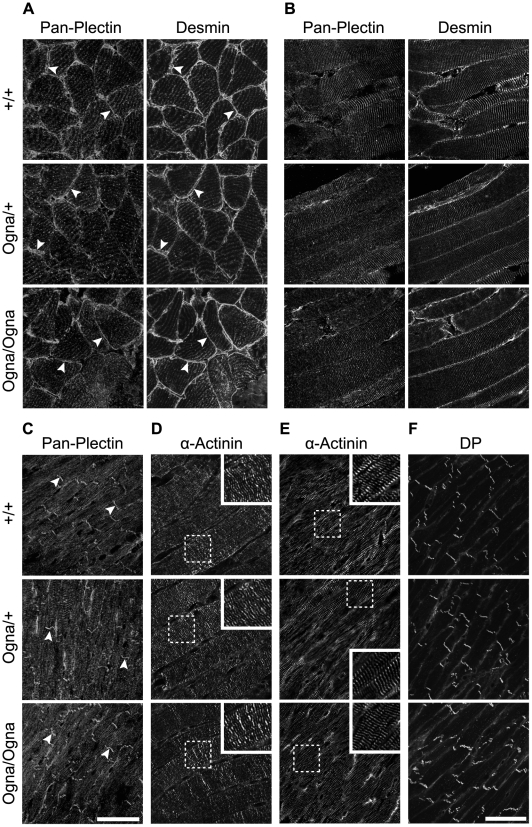
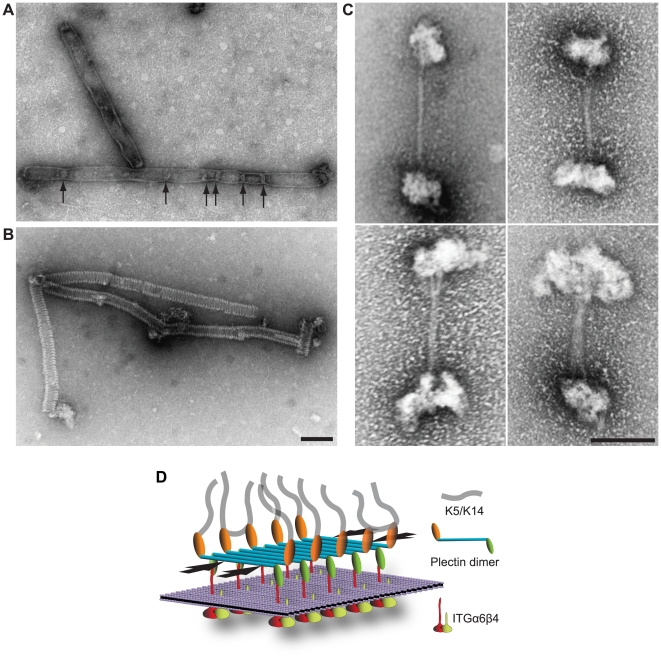
Autosomal recessive mutations in the cytolinker protein plectin account for the multisystem disorders epidermolysis bullosa simplex (EBS) associated with muscular dystrophy (EBS-MD), pyloric atresia (EBS-PA), and congenital myasthenia (EBS-CMS). In contrast, a dominant missense mutation leads to the disease EBS-Ogna, manifesting exclusively as skin fragility. We have exploited this trait to study the molecular basis of hemidesmosome failure in EBS-Ogna and to reveal the contribution of plectin to hemidesmosome homeostasis. We generated EBS-Ogna knock-in mice mimicking the human phenotype and show that blistering reflects insufficient protein levels of the hemidesmosome-associated plectin isoform 1a. We found that plectin 1a, in contrast to plectin 1c, the major isoform expressed in epidermal keratinocytes, is proteolytically degraded, supporting the notion that degradation of hemidesmosome-anchored plectin is spatially controlled. Using recombinant proteins, we show that the mutation renders plectin's 190-nm-long coiled-coil rod domain more vulnerable to cleavage by calpains and other proteases activated in the epidermis but not in skeletal muscle. Accordingly, treatment of cultured EBS-Ogna keratinocytes as well as of EBS-Ogna mouse skin with calpain inhibitors resulted in increased plectin 1a protein expression levels. Moreover, we report that plectin's rod domain forms dimeric structures that can further associate laterally into remarkably stable (paracrystalline) polymers. We propose focal self-association of plectin molecules as a novel mechanism contributing to hemidesmosome homeostasis and stabilization.


Conflict of interest statement

The authors have declared that no competing interests exist.

Figures

Figure 1
Figure 1. Phenotypical analysis of Ogna mice.
(A) Toluidine blue dye penetration assays. Note localized breaches (arrowheads) of the skin barrier in 1-day-old Plec Ogna/+ and Plec Ogna/Ogna mice, not noticeable in Plec +/+ littermates. (B) Epidermal detachment after tape stripping. Epidermal exfoliation was visible after 6 consecutive tape strippings of 1-day-old Plec Ogna/+ mice using D-Squame disks (CuDerm corporation, Dallas, TX) (arrow), whereas for Plec Ogna/Ogna mice, 2–3 tape strippings were usually enough for epidermal detachment (arrow). Brackets mark areas to which tape stripping was applied. (C) Transepidermal water loss (TEWL) after 6 consecutive tape strippings was strongly increased in 1-day-old Plec Ogna/+ mice, compared to their Plec +/+ littermates. Data are shown as mean values ±95% CI (n = 6). *** P<0.001 (two-way ANOVA with Bonferroni post test).
Figure 2
Figure 2. Histological and ultrastructural abnormalities of Ogna mouse skin.
(A) Epoxy resin-embedded and toluidine blue-stained skin sections from 1-day-old mice. Asterisks indicate trauma-induced blister formation between stratum basale (sb) and dermis (d), not observed in Plec +/+ mice. sc, stratum corneum. (B) Transmission electron microscopy of skin lesions. Arrowheads indicate intact HDs with attached keratin filament bundles (arrows) aligned along the basal cell membrane of basal keratinocytes in wild-type skin, and remnants of HDs lacking keratin filaments at blister (*) floors in mutant skin. (C,D) High magnification electron micrographs of intact skin sections of newborn (C) and adult (D) mice. (E) Outlines of HDs (grey bars) distributed along the basal cell membrane of basal keratinocytes (black lines) in panels D. Note reduced numbers and smaller sizes of HDs (arrowheads in C and D) in mutant, compared to Plec +/+ skin; also, few HDs in mutant skin have attached keratin filament bundles, whereas thick bundles of filaments attached to HDs are dominant in Plec+/+ skin (arrows in C and D). d and e (B–E), dermis and epidermis, respectively. Bars, 20 µm (A); 500 nm (B–D). (F,G) Morphometric analysis of HD numbers (average percentage of cross-sectioned basal cell membrane of basal keratinocytes containing HDs) (F) and keratin filament attachment (G) in adult mouse skin. A total length of 55–60 µm of basal cell membrane of basal keratinocytes was analyzed in electron micrographs of foot pad skin sections from wild-type and mutant littermates (n = 5, total numbers of HDs scored: Plec+/+, 617; PlecOgna/+, 590; PlecOgna/Ogna, 605). Box and whisker plots indicate the median (middle line in the box), the mean (small crosses), 25th percentile (bottom line of the box), 75th percentile (top line of the box), and 2.5th and 97.5th percentiles (whiskers). *** P<0.001, one-way ANOVA with Tukey post test for multiple comparisons.
Figure 3
Figure 3. Immunolocalization of HD proteins on frozen leg skin sections from 1-day-old wild-type and mutant mice.
(A–C) Visualization of plectin without isoform discrimination using mAb 10F6 (pan-plectin). Note downregulation of plectin expression in basal keratinocytes (opposing arrowheads) in mutant skin (B,C). (D–I) Visualization of P1c and P1a using isoform-specific antibodies. Expression and localization of P1c is comparable between all three genotypes (D–F). P1a is predominantly expressed at the basal cell membrane of basal keratinocytes in Plec +/+ skin (G, arrowheads), but is absent in mutant epidermis, except for a few P1a-positive patches (H, brackets) remaining in Plec Ogna/+ skin. Dashed lines, dermo-epidermal border. (J–L) Expression of ITGβ4 at the basal cell membrane of basal keratinocytes (arrowheads) is unaltered in Plec Ogna/+ skin (K), but slightly downregulated in Plec Ogna/Ogna cells (L). (M–O) The BPAG1 signal along the basal cell membrane of basal keratinocytes (arrowheads) is more discontinuous in mutant compared to Plec +/+ skin. Asterisks, unspecific labeling of stratum corneum in A–C and J–L. Bars in L (A–L) and O (M–O), 50 µm.
Figure 4
Figure 4. Normal plectin expression and contractile apparatus organization in muscle tissues of Ogna mice.
(A,B) Cross sections (A) and longitudinal sections (B) of soleus muscle were double immunolabeled for plectin and desmin. Note, similar expression patterns of plectin and desmin at the sarcolemma (arrowheads) of Plec +/+ and mutant muscle in (A). In longitundinal sections, plectin and desmin colocalized at Z-disks with no detectable difference in the staining patterns of Plec +/+ and mutant tissues. (C) Cardiac muscle immunolabeled for plectin. Note similar staining pattern of plectin at Z-disks and intercalated disk structures (arrowheads) in all tissues. Bar in C, 50 µm (representative for A–C). (D–F) Sarcomeric units in soleus (D) and cardiac muscle (E,F) labeled with anti-α-actinin (D,E) and anti-desmoplakin (F) antibodies. Note normal alignment of sarcomers in both skeletal and heart muscle (D,E) as well as well preserved intercalated disk structures in cardiac muscle of mutant mice (F). Bar in F, 50 µm (representative for D–F).
Figure 5
Figure 5. Compromised ex vivo formation and function of HPCs in Ogna keratinocytes.
(A) Immunolocalization (double labeling) of ITGα6 and plectin in primary keratinocytes isolated from newborn mice. In wild-type (+/+) keratinocytes ITGα6 and plectin show codistribution in densely clustered HPCs (arrowheads) contrasting the more diffuse distribution in Ogna keratinocytes. Bar, 20 µm. (B) Column diagram showing proportions (%) of wild-type (+/+) and mutant keratinocytes having formed (clustered), or lacking (diffuse) HPCs. Data are shown as mean values from cell counts (>100/genotype) in randomly chosen optical fields from three independent experiments ±95% CI. *** P<0.001, two-way ANOVA with Bonferroni post test. (C) Immunofluorescence microscopy images (contrast–enhanced by conversion to grey scale and inversion of contrast) of keratin 5 filament networks in hyperosmotic shock-treated (+urea) and non-treated keratinocytes. Note more advanced network collapse in Plec Ogna/+ (arrow) compared to wild-type keratinocytes. Bar, 20 µm. (D) Comparison of cell numbers re-populating scratch wounds (n = 15) 16 hours after wound infliction. Box and whisker plots as in Figure 2. *** P<0.001, unpaired two-tailed t-test. (E) Migration velocities of keratinocytes overexpressing wild-type and Ogna-P1a. Immortalized Plec +/+ keratinocytes, transfected with either full-length wild-type (WT) P1a (n = 30 cells), or Ogna P1a (n = 34 cells), or empty (GFP-expressing) vector (mock, n = 30 cells), were monitored for migration over a period of 20 hours. Box and whisker plots as in Figure 2). *** P<0.001, one-way ANOVA with Tukey post test for multiple comparisons.
Figure 6
Figure 6. Oligomerization of plectin's RD.
(A) Schematic representation of plectin's domain structure with exon allocation of subdomains and recombinant proteins expressed in baculovirus. 1's stands for 11 first exons alternatively spliced into exon 2. Highlighted are plectin's actin-binding domain (orange), the 9 spectrin repeats (green), the α-helical rod domain (light blue), and the C-terminal domain comprising 6 plectin repeats (dark blue). Red star, position of the Ogna mutation. pNV10 and pNV11, recombinant His-tagged wild-type and Ogna plectin RDs (135 kDa); pNV14 and pNV15, corresponding GST-tagged versions (158 kDa); pHLH20/wt and pHLH20/Ogna, recombinant His-tagged wild-type and Ogna versions of the RD flanked by the 9th spectrin repeat and the linker region between plectin's rod and the C-terminal region (170 kDa). (B) BN-(4–10%)-PAGE of recombinant wild-type (WT) and Ogna (O)-RDs using ferritin (440 and 880 kDa) as size marker. (C) Chemical cross-linking of RDs. Purified RD samples before and after cross-linking with DMS were analyzed by SDS-5%-PAGE. Note that i) the major cross-linked species (upper arrow) migrated just above the ∼500 kDa size marker (plectin), and ii) a fraction of both proteins could not be cross-linked in solution and was detected as monomers (lower arrow). (D) Molecular mass measurement by SEC-MALS analysis. The blue line traces the absorbance at 280 nm of the eluate from a Superose 6 10/300GL column as a function of time. The red dotted line represents the weight-average molecular weight of the species in the eluate, calculated from refractive index and light-scattering measurements. The protein peaks containing RD dimers and high molecular mass polymers are labeled with d and p, respectively. (E,F) Dissociation of plectin RD oligomers as a function of temperature and urea concentration. Samples were preincubated at increasing temperatures or concentrations of urea, cross-linked with DMS, and resolved by SDS-PAGE. The relative percentages of oligomers in each sample, determined by densitometric analysis of the gel lanes, were plotted as a function of temperature (E) or added urea (F). Data are shown as mean ±SD of three independent experiments performed in duplicates. The solid lines show the linear regression fit of the data (r2≥0.9689).
Figure 7
Figure 7. Molecular modeling of RD fragments harboring the p.Arg2000Trp mutation.
Ribbon views of three-dimensional models of parallel (A,B) and antiparallel (C,D) fragments of wild-type coiled-coil dimers (A and C), and of their p.Arg2000Trp mutant versions (B and D). Chains are colored according to blue-to-red (N to C terminus) scheme. The parallel dimeric coiled-coil model contains two copies of the segment 1988–2003 and the antiparallel dimeric model contains the segments 1988–2008 and 2587–2567. Note that arginine 2000 can form an intrahelical salt bridge with glutamine 1993, which is disrupted by the p.Arg2000Trp mutation.
Figure 8
Figure 8. RD polymer formation and model highlighting lateral RD association as a novel HD-stabilizing force.
(A,B) Electron microscopy of polymeric RD structures. pHLH20/wt-encoded recombinant versions of plectin's RD (Figure 6A) were incubated in 50 mM sodium phosphate, pH 7.4, 300 mM NaCl, 170 mM imidazole, and 1 mM PMSF for 1 hour at 37°C, before being processed for uranyl acetate staining and electron microscopy. Note that the slightly larger diameter of flat sheet/envelope-like structures visualized in (A) would correspond to that expected for collapsed (flat) tube-like structures visualized in (B). Constrictions (A, arrows) of sheet-like structures may represent transition states between flat (collapsed) and tube-like structures. Bar, 100 nm. (C) Electron microscopy of oligomeric dumbbell-like structures assembled from intact (full-length) plectin molecules. Plectin samples purified from rat glioma C6 cells in 7 M urea were dialysed into 2 mM Tris-HCl, pH 8.0, 5 mM β-mercaptoethanol, and 3 mM PMSF at 4°C overnight. Samples were then incubated in the presence of 10 mM CaCl2 at 37°C for 1 hour, and thereafter processed for negative staining electron microscopy. Note correlation between increasing sizes of globular end domains and stalk diameters of the four specimens shown. Bar, 100 nm. (D) Schematic model depicting the major protein-protein interactions that provide the mechanical stability of HDs. Interaction of P1a dimers with ITGβ4 and K5/K14 provides a vertical force component, whereas the ITGβ4-induced lateral association of multiple dimeric P1a molecules (in an anti-parallel fashion via their RDs) could generate an additional horizontal force component (arrows), parallel to the plasma membrane (violet sheet). Note that individual proteins are not drawn to scale and BPAG1e and BPAG2 are not depicted. In contrast to classical models of HD protein organization, the sheet-like association of plectin molecules in our model is better suited to incorporate the dimensions of plectin molecules (>230 nm) within the 50–60 nm thick HD inner plate.
Figure 9
Figure 9. Downregulation of P1a protein levels in Ogna keratinocytes.
(A) Immunoblotting of extracts prepared from Plec +/+, Plec Ogna/+, and Plec Ogna/Ogna epidermis using antibodies to proteins indicated. Sample loading was normalized to equal total protein contents and verified by immunoblotting using antibodies to GAPDH. (B) Densitometric quantification of plectin protein levels in mutant epidermal cell extracts relative to that in Plec +/+ samples (100%, red broken line) using E-cadherin as loading control. Data are shown as scatter dot plot. Values represent independent experiments (n = 4), horizontal lines indicate the mean, and error bars show 95% CI. Statistical significance between all genotypes was demonstrated by one-way ANOVA with Tukey posttest for multiple comparisons (P<0.01). Note that data shown for heterozygous plectin-null mice (+/−) were obtained in independent experiments (not shown in A). (C) Semiquantitative confocal microscopy analysis (n = 3 per group) of P1a protein levels in mutant relative to Plec+/+ epidermis (100%, red broken line), using identical image settings. Data presentation as in (B). Statistical significance between all genotypes (P<0.001) was demonstrated by one-way ANOVA with Tukey posttest for multiple comparisons. (D) Immunoblotting of cell lysates prepared from confluent primary keratinocytes grown in KGM/0.3 using antibodies to proteins indicated. Note, samples contained equal amounts of K5 and E-cadherin. (E,F) Densitometric quantification of plectin isoform levels in primary mutant keratinocytes relative to that in Plec +/+ samples (100%, red broken line) using K5 as loading control. Data presentation as in (B). In (E), statistical significance between all genotypes (P<0.05) was demonstrated by one-way ANOVA with Tukey posttest for multiple comparisons.
Figure 10
Figure 10. The Ogna mutation sensitizes plectin's RD to degradation by epidermis-specific proteolytic activities.
(A) Aliquots (10 µg) of GST-tagged wild-type RD (Figure 6A) were incubated (30 min, 30°C) with (+) or without (−) epidermal protein extract (5 µg) in the presence of the protease inhibitors indicated [MDL, MDL-28170 (50 µM); ALLN, N-Acetyl-Leu-Leu-Nle-CHO (5 µM); MG, MG132 (Z-Leu-Leu-Leu-al, 20 µM); EDTA (10 mM), PMSF (2 mM)], or vehicle (DMSO) alone. Samples were separated by SDS-8% PAGE and RDs were detected by immunoblotting using anti-plectin mAb 10F6. Note that RDs exhibit electrophoretic mobilities slightly lower than expected for a protein with a calculated molecular mass of ∼158 kDa. Also note multiple RD degradation products (*) in lanes DMSO and MG. (B) Assay conditions as in (A), except that 10 or 100 nM Bortezomib (BTZ), and 0.9% (w/v) NaCl were used as protease inhibitor and sole vehicle, respectively. (C) Degradation of wild-type (WT) and mutant plectin RDs (O) by epidermal protease(s) as a function of incubation time. Assay conditions as in (A), except that no protease inhibitors were added and incubations times varied as indicated. Note faster degradation of the Ogna compared to the wild-type RD version. Arrows in (A–C) denote the position of intact RD proteins. Note faster degradation of the Ogna RD compared to the wild-type rod version. (D) Degradation kinetics of wild-type versus Ogna RD. The relative amounts of intact RD (as determined by densitometry) were plotted as a function of incubation time with epidermal protein extract. Data are shown as mean ±SEM of three independent experiments.
Figure 11
Figure 11. Calpain inhibitors restore P1a expression and HD formation in Ogna keratinocytes and Ogna mice.
(A) Immunoblotting of cell lysates from primary PlecOgna/Ogna keratinocytes grown to ∼70% confluence in KGM/0.3, and exposed to either DMSO (solvent) alone, or calpain inhibitor ALLN (10 µM) for up to 24 hours. Note, samples analyzed contained equal amounts of calpain-1 and K5. Numbers below lanes represent protein ratios relative to an arbitrary level of 1.0 assigned to the control (solvent) sample. One of three experiments is shown. (B) Primary PlecOgna/Ogna keratinocytes grown as in (A) were exposed to DMSO (solvent) alone, or calpain inhibitor MDL-28170 (50 µM) for 48 hours. The bar diagram shows proportions (%) of solvent- and MDL-28170-treated cells having formed HPCs. Data shown represent mean values of cell counts (>500/genotype) in randomly chosen optical fields from three independent experiments ±95% CI. *** P<0.001, unpaired Student's t-test. (C) Visualization of P1a on frozen sections of mouse tail skin using P1a-specific antibodies. Note that in tail skin of PlecOgna/+ mice treated with MDL-28170 there was a clear increase in P1a levels compared to mice treated with DMSO (solvent) only; even though the restored P1a levels did not reach the levels of Plec+/+ controls. Arrowheads, basal cell membrane of basal keratinocytes. Bar, 20 µm. (D) Semiquantitative confocal microscopy analysis (n = 5 per group) of P1a levels in MDL-28170- relative to DMSO (solvent)-treated samples (100%, red broken line) using identical image settings. Note that the mean intensities of P1a fluorescence signals had increased ∼2-fold (compared with untreated skin) after treating PlecOgna/+ mice for 5 days with MDL-28170. Box and whisker plot as in Figure 2. P<0.01, unpaired Student's t test. (E) Immunoblotting of tissue extracts prepared from tail skin epidermis using antibodies to calpain-1. Note partial inhibition of autoproteolytic calpain-1 cleavage upon topical treatment of PlecOgna/+ mouse tails with MDL-28170.

Similar articles

Cited by

References

    1. Litjens SH, de Pereda JM, Sonnenberg A. Current insights into the formation and breakdown of hemidesmosomes. Trends Cell Biol. 2006;16:376–383. - PubMed
    1. Wiche G. Role of plectin in cytoskeleton organization and dynamics. J Cell Sci. 1998;111(Pt 17):2477–2486. - PubMed
    1. Rezniczek GA, Walko G, Wiche G. Plectin gene defects lead to various forms of epidermolysis bullosa simplex. Dermatol Clin. 2010;28:33–41. - PubMed
    1. Rezniczek GA, Abrahamsberg C, Fuchs P, Spazierer D, Wiche G. Plectin 5′-transcript diversity: short alternative sequences determine stability of gene products, initiation of translation and subcellular localization of isoforms. Hum Mol Genet. 2003;12:3181–3194. - PubMed
    1. Fuchs P, Zorer M, Rezniczek GA, Spazierer D, Oehler S, et al. Unusual 5′ transcript complexity of plectin isoforms: novel tissue-specific exons modulate actin binding activity. Hum Mol Genet. 1999;8:2461–2472. - PubMed

Publication types

MeSH terms