

Adaptive timing of motor output in the mouse: the role of movement oscillations in eyelid conditioning
- PMID: 22144951
- PMCID: PMC3226833
- DOI: 10.3389/fnint.2011.00072
Adaptive timing of motor output in the mouse: the role of movement oscillations in eyelid conditioning
Abstract
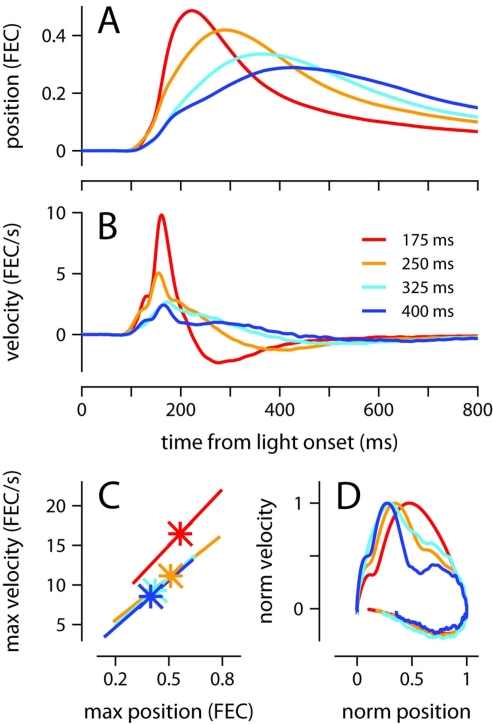
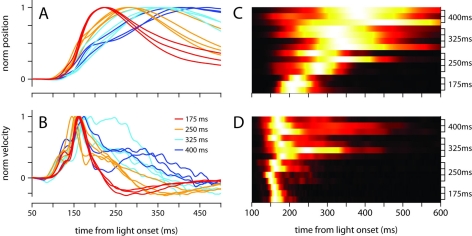
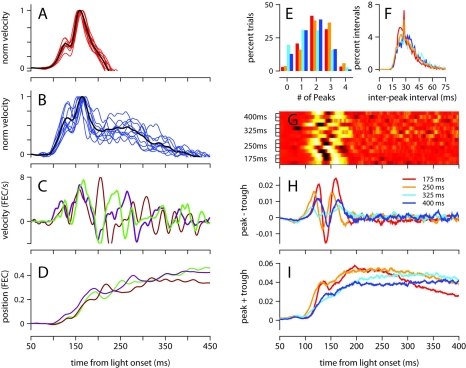
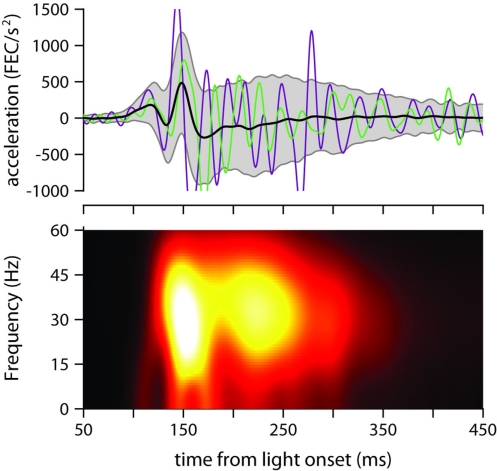
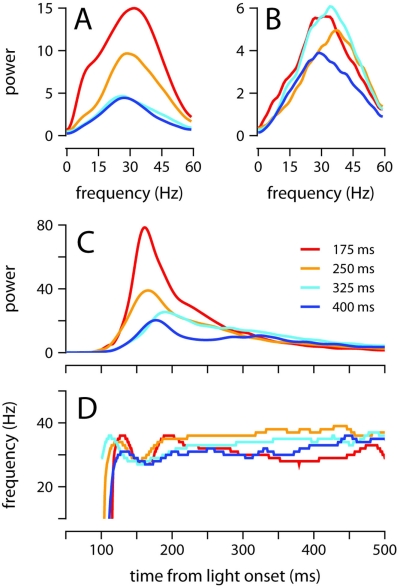
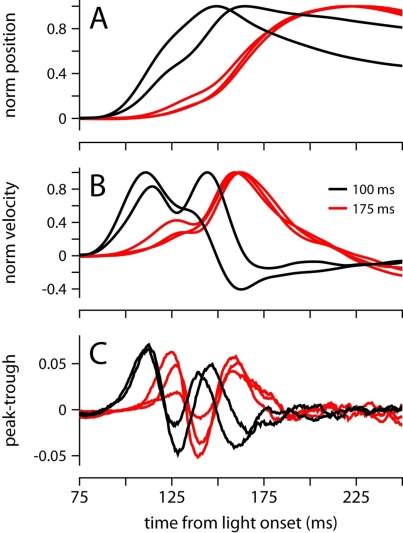
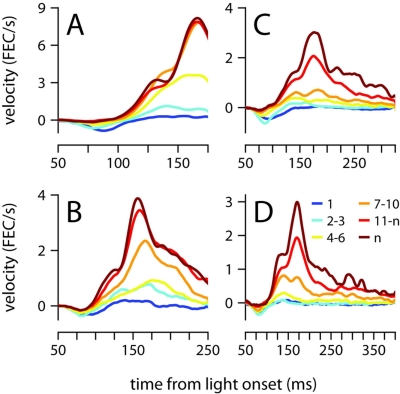
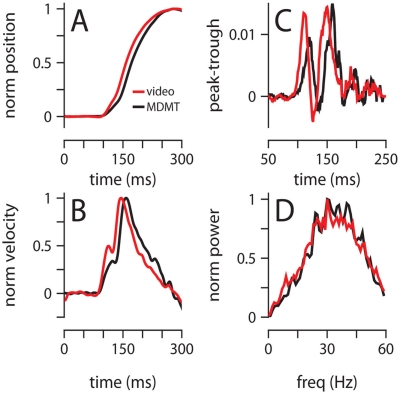
To survive, animals must learn to control their movements with millisecond-level precision, and adjust the kinematics if conditions, or task requirements, change. Here, we examine adaptive timing of motor output in mice, using a simple eyelid conditioning task. Mice were trained to blink in response to a light stimulus that was always followed by a corneal air-puff at a constant time interval. Different mice were trained with different intervals of time separating the onset of the light and the air-puff. As in previous work in other animal species, mice learned to control the speed of the blink, such that the time of maximum eyelid closure matched the interval used during training. However, we found that the time of maximum eyelid speed was always in the first 100 ms after movement onset and did not scale with the training interval, indicating that adaptive timing is not accomplished by slowing down (or speeding up) the eyelid movement uniformly throughout the duration of the blink. A new analysis, specifically designed to examine the kinematics of blinks in single trials, revealed that the underlying control signal responsible for the eyelid movement is made up of oscillatory bursts that are time-locked to the light stimulus at the beginning of the blink, becoming desynchronized later on. Furthermore, mice learn to blink at different speeds and time the movement appropriately by adjusting the amplitude, but not the frequency of the bursts in the eyelid oscillation.
Keywords: cerebellum; eyeblink; interstimulus interval; invariance; learning.
Figures
Similar articles
-
Kinematics of spontaneous, reflex, and conditioned eyelid movements in the alert cat.J Neurophysiol. 1995 Jul;74(1):226-48. doi: 10.1152/jn.1995.74.1.226. J Neurophysiol. 1995. PMID: 7472326
-
Kinetic and frequency-domain properties of reflex and conditioned eyelid responses in the rabbit.J Neurophysiol. 2000 Feb;83(2):836-52. doi: 10.1152/jn.2000.83.2.836. J Neurophysiol. 2000. PMID: 10669498
-
Learning and Timing of Voluntary Blink Responses Match Eyeblink Conditioning.Sci Rep. 2017 Jun 13;7(1):3404. doi: 10.1038/s41598-017-03343-2. Sci Rep. 2017. PMID: 28611360 Free PMC article.
-
Conditioned eyelid movement is not a blink.J Neurophysiol. 2010 Feb;103(2):641-7. doi: 10.1152/jn.00631.2009. Epub 2009 Nov 25. J Neurophysiol. 2010. PMID: 19939960 Free PMC article.
-
Are Purkinje Cell Pauses Drivers of Classically Conditioned Blink Responses?Cerebellum. 2016 Aug;15(4):526-34. doi: 10.1007/s12311-015-0722-4. Cerebellum. 2016. PMID: 26400585 Free PMC article. Review.
Cited by
-
Spine loss in primary somatosensory cortex during trace eyeblink conditioning.J Neurosci. 2015 Mar 4;35(9):3772-81. doi: 10.1523/JNEUROSCI.2043-14.2015. J Neurosci. 2015. PMID: 25740508 Free PMC article.
-
Whisker-signaled Eyeblink Classical Conditioning in Head-fixed Mice.J Vis Exp. 2016 Mar 30;(109):e53310. doi: 10.3791/53310. J Vis Exp. 2016. PMID: 27077752 Free PMC article.
-
Delayed Complex Spike Response Evoked by Conditioned Stimulus Encodes Movement Onset Time and Is Determined by Intrinsic Inferior Olive Properties.Front Syst Neurosci. 2019 Oct 9;13:50. doi: 10.3389/fnsys.2019.00050. eCollection 2019. Front Syst Neurosci. 2019. PMID: 31649513 Free PMC article.
-
SK2 channels in cerebellar Purkinje cells contribute to excitability modulation in motor-learning-specific memory traces.PLoS Biol. 2020 Jan 6;18(1):e3000596. doi: 10.1371/journal.pbio.3000596. eCollection 2020 Jan. PLoS Biol. 2020. PMID: 31905212 Free PMC article.
-
Dynamic modulation of activity in cerebellar nuclei neurons during pavlovian eyeblink conditioning in mice.Elife. 2017 Dec 15;6:e28132. doi: 10.7554/eLife.28132. Elife. 2017. PMID: 29243588 Free PMC article.
References
-
- Baker R., McCrea R. A., Spencer R. F. (1980). Synaptic organization of cat accessory abducens nucleus. J. Neurophysiol. 43, 771–791 - PubMed
Grants and funding
LinkOut - more resources
Full Text Sources
Research Materials