. 2011:2011:565647.
doi: 10.1155/2011/565647. Epub 2011 Nov 15.

Involvement of F-actin in chaperonin-containing t-complex 1 beta regulating mouse mesangial cell functions in a glucose-induction cell model

Affiliations

Involvement of F-actin in chaperonin-containing t-complex 1 beta regulating mouse mesangial cell functions in a glucose-induction cell model

Jin-Shuen Chen et al. Exp Diabetes Res. 2011.

Abstract

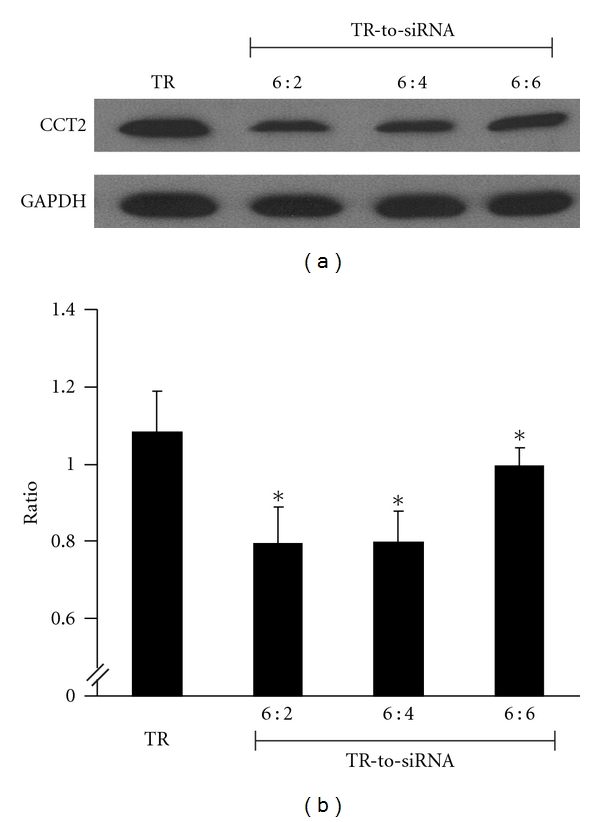
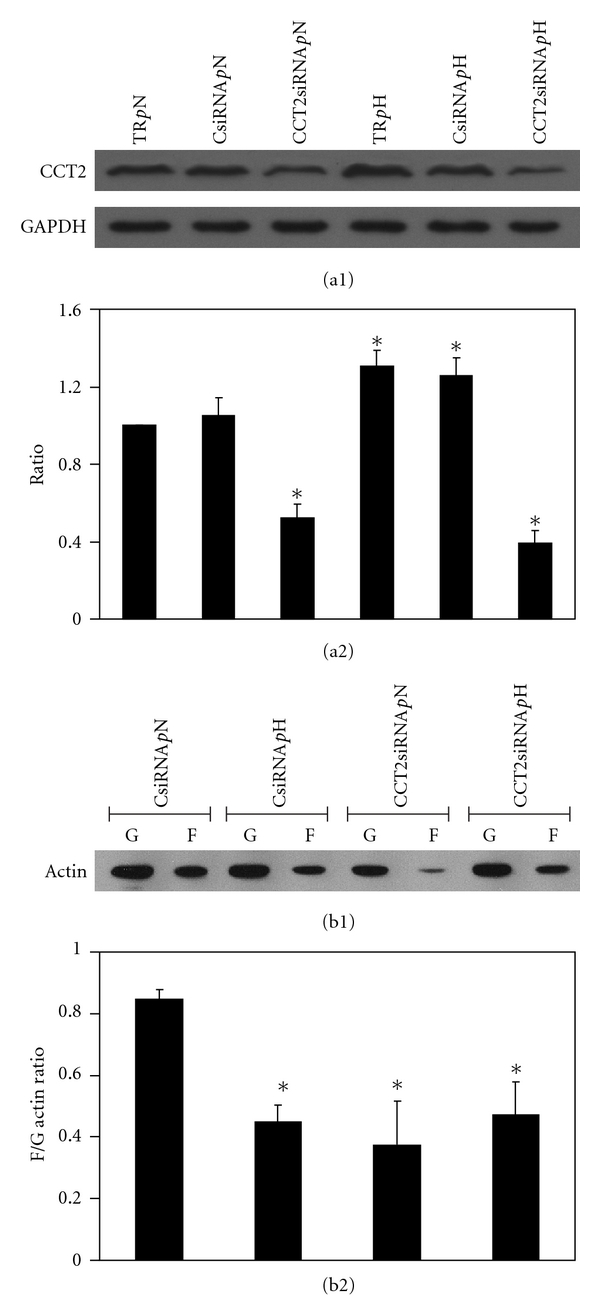
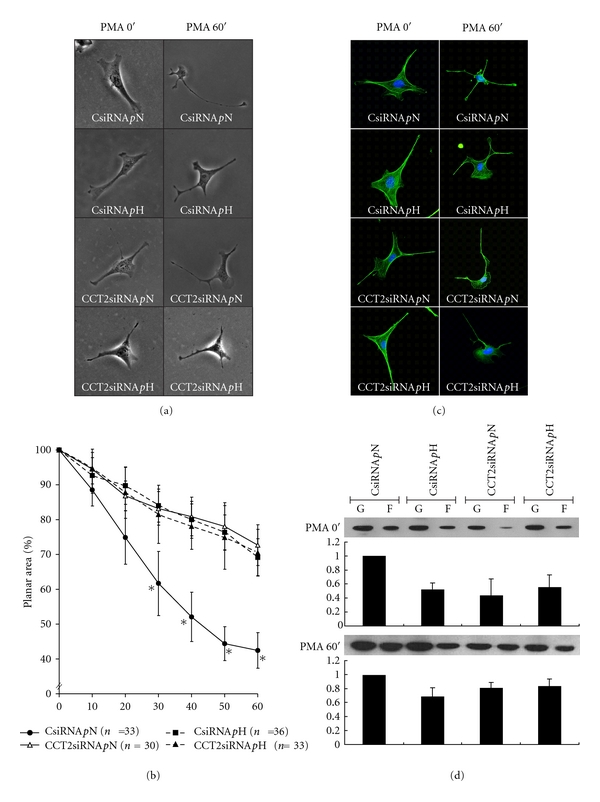
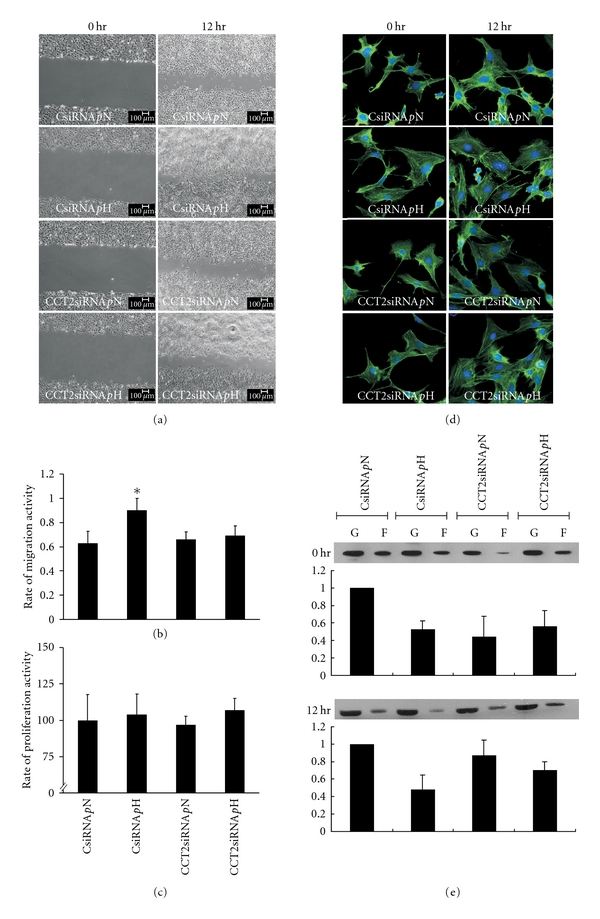
The aim of this study is to investigate the role of chaperonin-containing t-complex polypeptide 1 beta (CCT2) in the regulation of mouse mesangial cell (mMC) contraction, proliferation, and migration with filamentous/globular-(F/G-) actin ratio under high glucose induction. A low CCT2 mMC model induced by treatment of small interference RNA was established. Groups with and without low CCT2 induction examined in normal and high (H) glucose conditions revealed the following major results: (1) low CCT2 or H glucose showed the ability to attenuate F/G-actin ratio; (2) groups with low F/G-actin ratio all showed less cell contraction; (3) suppression of CCT2 may reduce the proliferation and migration which were originally induced by H glucose. In conclusion, CCT2 can be used as a specific regulator for mMC contraction, proliferation, and migration affected by glucose, which mechanism may involve the alteration of F-actin, particularly for cell contraction.


Figures

Figure 1
Figure 1
Optimal ratio between transfection reagent (TR) and volume of siRNA (TR-to-siRNA) for a low CCT2 mouse mesangial cell (mMC) model. The volume of TR was fixed at 6 ul, and transfection was performed with varying volumes of CCT2 siRNA. Representative plots show (a) western blotting used for the expression of CCT2 in mMC treated by TR only and TR plus CCT2siRNA at the ratios of 6 : 2, 6 : 4, and 6 : 6 and (b) the normalized CCT2 expression against GAPDH for above groups, in which group 6 : 2 displays an ideal suppressive effect on CCT2 and was chosen for subsequent experiments. *P < 0.05 versus group TR.
Figure 2
Figure 2
CCT2 and F/G-actin ratios in the CCT2 cell model with and without high glucose induction. The TR-to-siRNA ratio of 6 : 2 was used for the CCT2 knockdown experiment with evaluation of F/G-actin ratio on six designated groups. Representative plots show (a1) western blotting CCT2 expression and (a2) the normalized CCT2 expression against GAPDH for the six groups, in which induction of CCT2 expression was observed with high glucose group of transfection reagent (TR pH) and scramble siRNA (CsiRNA pH) and reduction of CCT2 expression was with normal glucose group (CCT2siRNA pN) and high glucose group (CCT2siRNA pH) of siRNA as compared to control group (TR pN). *Denotes P < 0.05 versus group TR pN. Under the same conditions, changes of the F/G-actin ratio were investigated with four subtly designated groups. As representative plot (b1) shows the expression of F- and G-actins responding to the four conditions, and plot (b2) shows the ratios of F-actin and G-actin expressed in the four conditions. Compared to control group CsiRNA pN, the decrease of F/G-actin ratio was observed for all experimental groups *P < 0.05.
Figure 3
Figure 3
Change of cell contraction, F/G-actin ratio, and arrangement of F-actin in the CCT2 cell model with and without glucose stimulation. Four designated conditions varying in culture medium containing CCT2 or scramble siRNA were used to study the changes of the planar areas of mMC in response to 1 μM PMA stimulation. Representative plots show (a) the morphological changes of mMC (magnification 250x) before (0 min) and after (60 min) PMA treatment and (b) the degrees of cell contraction recorded at 10-min intervals. As group CsiRNA pN exhibited the highest contractility with 40–50% planar area reduction at 60 min, the other groups disclosed lower contractility 30 min after PMA stimulation, whereas n denotes the number of cells and ∗ represents P < 0.05 versus CsiRNA pN. Changes in actin were studied in the same conditions. Representative pictures show (c) the immunohistochemical blotting of actin in mMC with highlighting F-actin (green) and nuclei (blue) and (d) the change of F/G-actin ratio before and after PMA stimulation, in which a similar pattern persisted for the four groups.
Figure 4
Figure 4
Change of cell proliferation, migration, F/G-actin ratio, and arrangement of F-actin in CCT2 cell model with and without high glucose stimulation. The same four designated groups in previous experiments were studied with high and normal glucose cultured for 24 hrs. Then, wound healing assay was performed to evaluate mMC migration. Representative pictures show (a) the images of mMC migration to close the wound, (b) the rate of migration, and (c) the rate of proliferation during the 12 hr testing interval. Group CsiRNA pH exhibited the highest migration activity among these groups. These experiments were performed in triplicate, and the rate of migration activity was calculated as %  = (area at 0 hr–area at 12 hr)/area at 0 hr. Changes in actin were also studied. Representative pictures show (d) the immunohistochemical blotting of actin with highlighting F-actin (green) and nuclei (blue) and (e) the change of F/G-actin ratio during the migration testing interval. As seen, a similar pattern of no significant change was observed across the four groups.

References

    1. Ueta M, Wakisaka M, Ago T, et al. PPARγ ligands attenuate mesangial contractile dysfunction in high glucose. Kidney International. 2004;65(3):961–971. - PubMed
    1. Schaeffer V, Hansen KM, Morris DR, Abrass CK. Reductions in laminin β2 mRNA translation are responsible for impaired IGFBP-5-mediated mesangial cell migration in the presence of high glucose. American Journal of Physiology. 2010;298(2):F314–F322. - PMC - PubMed
    1. Hugo C, Shankland SJ, Bowen-Pope DF, Couser WG, Johnson RJ. Extraglomerular origin of the mesangial cell after injury. A new role of the juxtaglomerular apparatus. The Journal of Clinical Investigation. 1997;100(4):786–794. - PMC - PubMed
    1. Cove-Smith A, Hendry BM. The regulation of mesangial cell proliferation. Nephron—Experimental Nephrology. 2008;108(4):e74–e79. - PubMed
    1. Schlöndorff D, Banas B. The mesangial cell revisited: no cell is an island. Journal of the American Society of Nephrology. 2009;20(6):1179–1187. - PubMed

Publication types

MeSH terms

LinkOut - more resources