Number of natural teeth and oral impacts: a study on sri lankan adults
- PMID: 22145004
- PMCID: PMC3227509
- DOI: 10.1155/2011/809620
Number of natural teeth and oral impacts: a study on sri lankan adults
Abstract
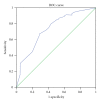
The aim of the study was to determine the association between the number of natural teeth and oral impacts in Sri Lankan adults. The sample consisted of 476, 40-59 and 452, ≥60 year olds. Oral impacts were assessed using a validated Sinhalese translation of the Oral Health Impact Profile-14 scale. A receiver-operating characteristic (ROC) curve was plotted to determine the number of natural teeth that would best discriminate those with oral impacts from those without. Oral impacts were reported by 26% of the 40-59 year olds and 34% of the older individuals. In both groups there was a significant negative correlation between the number of teeth present and oral impacts. The ROC curve for the 40-59 year olds gave an area under the curve (AUC) of 0.758 (95% CI = 0.702-0.814; P < 0.001) with an optimal cut-off of 24/25 teeth while for the ≥60 year olds, the AUC of the ROC curve was 0.737 (95% CI = 0.684-0.790; P < 0.001) with an optimal cut-off of 18/19 teeth. Based on the ROC curves the optimal cutoffs of the number of natural teeth that best discriminated between those with and without oral impacts for 40-59 and ≥60 year olds were 24-25 and 18-19, respectively.
Figures


Similar articles
-
Oral impacts and their association with tooth loss in Sri Lankan adults.Community Dent Health. 2012 Sep;29(3):214-8. Community Dent Health. 2012. PMID: 23038937
-
Key factors associated with oral health-related quality of life in Sri Lankan adolescents: a cross sectional study.BMC Oral Health. 2021 Apr 29;21(1):218. doi: 10.1186/s12903-021-01569-1. BMC Oral Health. 2021. PMID: 33926434 Free PMC article.
-
Validation of Adolescent Suicide Assessment Protocol-20 (ASAP-20) to Sri Lankan adolescents.Asian J Psychiatr. 2018 Mar;33:11-17. doi: 10.1016/j.ajp.2018.02.016. Epub 2018 Feb 24. Asian J Psychiatr. 2018. PMID: 29505971
-
Oral health of individuals aged 3-80 years in Jönköping, Sweden during 30 years (1973-2003). II. Review of clinical and radiographic findings.Swed Dent J. 2005;29(4):139-55. Swed Dent J. 2005. PMID: 16463570 Review.
-
Understanding diagnostic tests 3: Receiver operating characteristic curves.Acta Paediatr. 2007 May;96(5):644-7. doi: 10.1111/j.1651-2227.2006.00178.x. Epub 2007 Mar 21. Acta Paediatr. 2007. PMID: 17376185 Review.
References
-
- Tsakos G, Marcenes W, Sheiham A. The relationship between clinical dental status and oral impacts in an elderly population. Oral Health Prev Dent. 2004;2(3):211–220. - PubMed
-
- Zeng X, Sheiham A, Bernabé E, Tsakos G. Relationship between dental status and Oral Impacts on Daily Performances in older Southern Chinese people. Journal of Public Health Dentistry. 2010;70(2):101–107. - PubMed
-
- Federation Dentaire Internationale/World Health Organization. Global goals for oral health in the year 2000. International Dental Journal. 1982;32(1):74–77. - PubMed
-
- Gotfredsen K, Walls AWG. What dentition assures oral function? Clinical Oral Implants Research. 2007;18(supplement 3):34–45. - PubMed
-
- Steele JG, Sanders AE, Slade GD, et al. How do age and tooth loss affect oral health impacts and quality of life? A study comparing two national samples. Community Dentistry and Oral Epidemiology. 2004;32(2):107–114. - PubMed
LinkOut - more resources
Full Text Sources

