. 2011;6(12):e28505.
doi: 10.1371/journal.pone.0028505. Epub 2011 Dec 1.

Selective ion changes during spontaneous mitochondrial transients in intact astrocytes

Affiliations

Selective ion changes during spontaneous mitochondrial transients in intact astrocytes

Guillaume Azarias et al. PLoS One. 2011.

Abstract

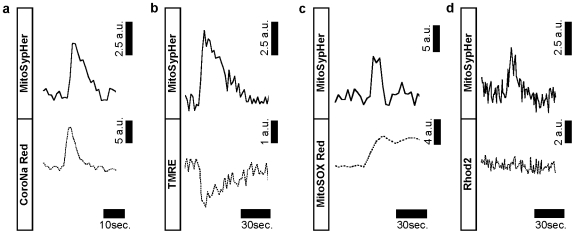
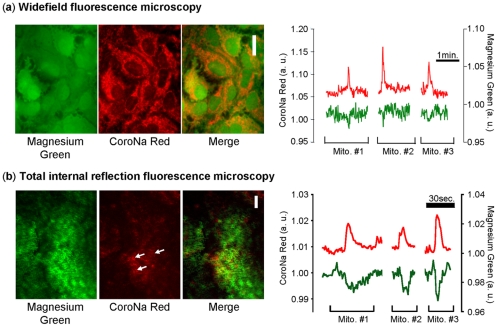
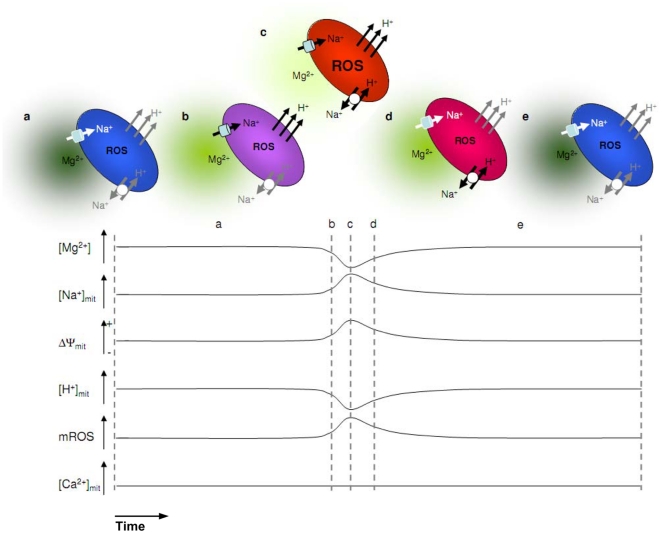
The bioenergetic status of cells is tightly regulated by the activity of cytosolic enzymes and mitochondrial ATP production. To adapt their metabolism to cellular energy needs, mitochondria have been shown to exhibit changes in their ionic composition as the result of changes in cytosolic ion concentrations. Individual mitochondria also exhibit spontaneous changes in their electrical potential without altering those of neighboring mitochondria. We recently reported that individual mitochondria of intact astrocytes exhibit spontaneous transient increases in their Na(+) concentration. Here, we investigated whether the concentration of other ionic species were involved during mitochondrial transients. By combining fluorescence imaging methods, we performed a multiparameter study of spontaneous mitochondrial transients in intact resting astrocytes. We show that mitochondria exhibit coincident changes in their Na(+) concentration, electrical potential, matrix pH and mitochondrial reactive oxygen species production during a mitochondrial transient without involving detectable changes in their Ca(2+) concentration. Using widefield and total internal reflection fluorescence imaging, we found evidence for localized transient decreases in the free Mg(2+) concentration accompanying mitochondrial Na(+) spikes that could indicate an associated local and transient enrichment in the ATP concentration. Therefore, we propose a sequential model for mitochondrial transients involving a localized ATP microdomain that triggers a Na(+)-mediated mitochondrial depolarization, transiently enhancing the activity of the mitochondrial respiratory chain. Our work provides a model describing ionic changes that could support a bidirectional cytosol-to-mitochondria ionic communication.


Conflict of interest statement

Competing Interests: The authors have declared that no competing interests exist.

Figures

Figure 1
Figure 1. Spontaneous alkaline transients in individual mitochondria.
(a) Astrocyte mitochondria exhibit individual spontaneous transient alkalinization of mitochondrial matrix as revealed using the mitochondrially-targeted pH-sensitive sensor MitoSypHer. A mitochondrion exhibiting a mitochondrial alkaline transient is indicated with an arrow in the bottom image. Images were taken at t = 3, 19, 55 and 70 sec. Scale bar: 10 µm (b) Example trace of calibrated mitochondrial alkaline transient in single mitochondrion of resting astrocytes. (c) Distribution of duration of spontaneous mitochondrial alkaline transients. (d) Distribution of amplitude of spontaneous mitochondrial alkaline transients. (n = 6 exp, 30 mitochondria)
Figure 2
Figure 2. Spontaneous mitochondrial alkaline transients are coincident with mitochondrial Na+ transients, mitochondrial depolarization, and bursts of superoxide generation.
(a) Mitochondrial alkaline transients are coincident with mitochondrial Na+ transients. Astrocytes were transfected with MitoSypHer and subsequently loaded with CoroNa Red to monitor pH and Na+, respectively in the same mitochondria. Experimental trace depicting spontaneous pH changes (top trace) and Na+ changes (bottom trace). (n = 6 exp, 27 mitochondria). (b) Mitochondrial alkaline transients are coincident with mitochondrial depolarization. MitoSypHer transfected astrocytes were loaded with TMRE in unquenched mode to monitor pH and electrical potential, respectively in the same mitochondria. Experimental trace depicting spontaneous pH changes (top trace) and mitochondrial electrical potential changes (bottom trace). (n = 6 exp, 14 mitochondria) (c) Mitochondrial alkaline transients are coincident with burst of superoxide generation. MitoSypHer transfected astrocytes were loaded with MitoSOX Red to monitor pH and mROS level, respectively in the same mitochondria. Experimental trace depicting spontaneous pH changes (top trace) and mROS (bottom trace). (n = 8 exp, 24 mitochondria). (d) Mitochondrial alkaline transients are not coincident with detectable changes in mitochondrial Ca2+ concentration. MitoSypHer transfected astrocytes were labeled with Rhod2 to monitor pH and Ca2+ in the same mitochondria. Experimental trace depicting spontaneous pH changes (top trace) and Ca2+ changes changes (bottom trace). (n = 7 exp, 16 mitochondria).
Figure 3
Figure 3. Mitochondrial Na+ transients are coincident with transient decrease in cytosolic Mg2+ concentration.
Astrocytes were loaded with Magnesium Green AM and CoroNa Red to monitor local free Mg2+ concentration and mitochondrial Na+ spikes. (a) Fluorescence images of astrocytes showing the typical cytosolic and mitochondrial patterns of Magnesium green and CoroNa Red, respectively observed under widefield microscopy. Experimental trace depicting spontaneous mitochondrial Na+ spikes (red trace, left axis) and free Mg2+ concentration (green trace, right axis). Scale bar: 20 µm (n = 6 exp, 24 mitochondria). (b) Fluorescence images of an astrocyte showing the fluorescence patterns of Magnesium green and CoroNa Red, respectively observed under TIRF microscopy. White arrows indicate where mitochondria are almost entirely located in the field of the evanescent wave. Experimental trace depicting spontaneous mitochondrial Na+ spikes (red trace, left axis) and free Mg2+ concentration (green trace, right axis). Scale bar 10 µm (n = 5 exp, 19 mitochondria).
Figure 4
Figure 4. Model for ionic alterations occurring during mitochondrial transients.
(a) and (e) are resting mitochondria in the cytosol with a basal free Mg2+ level. (b) to (d) illustrate the putative different states of the same mitochondrion experiencing a spontaneous transient, according to the proposed model. The dark to white green squares near the mitochondrion illustrate the normal resting to low Mg2+ concentration, respectively. The cold blue to hot red colors of the mitochondria illustrate the mitochondrial electrical potential, from hyperpolarized to depolarized, respectively. Na+ and H+ pathways are represented in white, gray and black corresponding to inactive, constitutive and maximal activities, respectively. The bottom traces summarize the respective changes in Mg2+ as well as mitochondrial Na+, electrical potential, H+, ROS, and Ca2+, measured in the present study.

References

    1. Jeninga EH, Schoonjans K, Auwerx J. Reversible acetylation of PGC-1: connecting energy sensors and effectors to guarantee metabolic flexibility. Oncogene. 2010;29:4617–4624. - PMC - PubMed
    1. Hajnoczky G, Robbgaspers LD, Seitz MB, Thomas AP. Decoding of cytosolic calcium oscillations in the mitochondria. Cell. 1995;82:415–424. - PubMed
    1. Azarias G, Perreten H, Lengacher S, Poburko D, Demaurex N, et al. Glutamate transport decreases mitochondrial pH and modulates oxidative metabolism in astrocytes. Journal of Neuroscience. 2011;31:3550–3559. - PMC - PubMed
    1. Balaban RS, Nemoto S, Finkel T. Mitochondria, oxidants, and aging. Cell. 2005;120:483–495. - PubMed
    1. Demaurex N, Distelhorst C. Cell biology. Apoptosis--the calcium connection. Science. 2003;300:65–67. - PubMed

Publication types