. 2011 Nov;1(6):524-38.
doi: 10.1158/2159-8290.CD-11-0124. Epub 2011 Sep 13.

Oncogenic EGFR signaling activates an mTORC2-NF-κB pathway that promotes chemotherapy resistance

Affiliations

Oncogenic EGFR signaling activates an mTORC2-NF-κB pathway that promotes chemotherapy resistance

Kazuhiro Tanaka et al. Cancer Discov. 2011 Nov.

Abstract

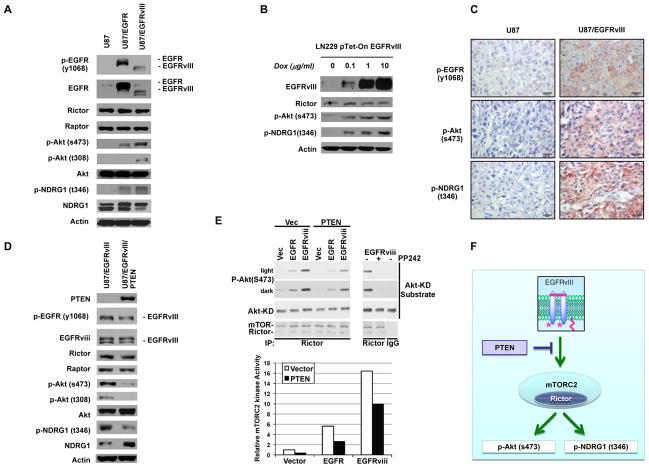
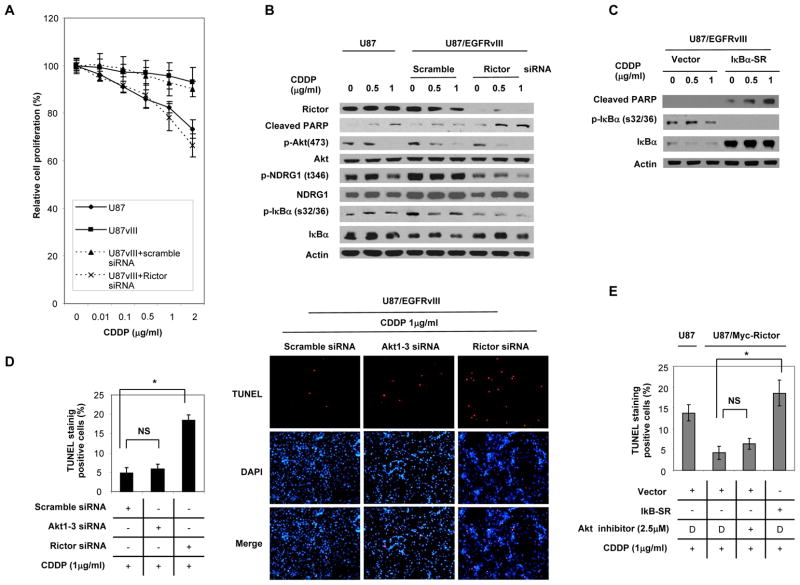
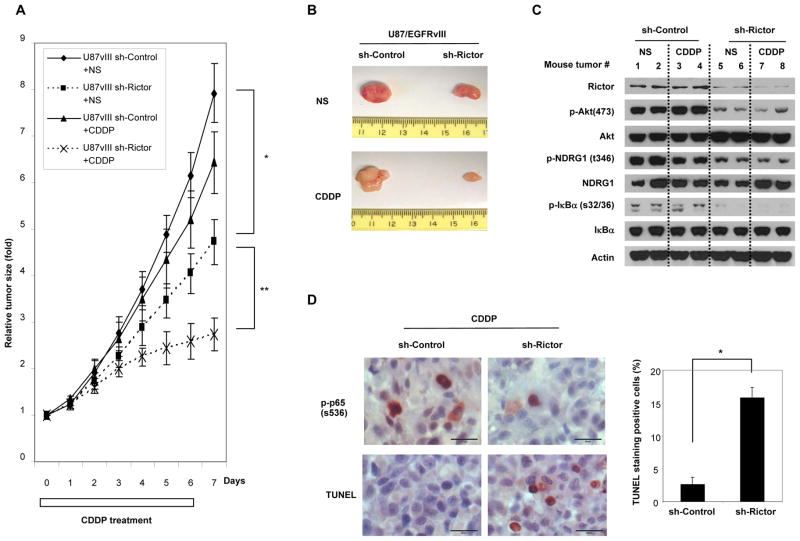
Although it is known that mTOR complex 2 (mTORC2) functions upstream of Akt, the role of this protein kinase complex in cancer is not well understood. Through an integrated analysis of cell lines, in vivo models, and clinical samples, we demonstrate that mTORC2 is frequently activated in glioblastoma (GBM), the most common malignant primary brain tumor of adults. We show that the common activating epidermal growth factor receptor (EGFR) mutation (EGFRvIII) stimulates mTORC2 kinase activity, which is partially suppressed by PTEN. mTORC2 signaling promotes GBM growth and survival and activates NF-κB. Importantly, this mTORC2-NF-κB pathway renders GBM cells and tumors resistant to chemotherapy in a manner independent of Akt. These results highlight the critical role of mTORC2 in the pathogenesis of GBM, including through the activation of NF-κB downstream of mutant EGFR, leading to a previously unrecognized function in cancer chemotherapy resistance. These findings suggest that therapeutic strategies targeting mTORC2, alone or in combination with chemotherapy, will be effective in the treatment of cancer.

Significance: This study demonstrates that EGFRvIII-activated mTORC2 signaling promotes GBM proliferation, survival, and chemotherapy resistance through Akt-independent activation of NF-κB. These results highlight the role of mTORC2 as an integrator of two canonical signaling networks that are commonly altered in cancer, EGFR/phosphoinositide-3 kinase (PI3K) and NF-κB. These results also validate the importance of mTORC2 as a cancer target and provide new insights into its role in mediating chemotherapy resistance, suggesting new treatment strategies.

Keywords: EGFRvIII; NF-κB; Rictor; and chomotherapy resistance; mTORC2.


Figures

Figure 1
Figure 1. EGFRvIII stimulates mTORC2 activation in vitro and in vivo
(A) Biochemical analysis of EGFRvIII/EGFR signaling on mTORC2 biomarkers using U87 isogenic cells. Cell lines were cultured in serum-free media for 24 hours. (B) Immunoblot analysis of LN229 GBM cells in which EGFRvIII was placed under a doxycycline regulatable promoter. (C) Representative immunohistochemical images demonstrating p-EGFR(Y1068), p-Akt(S473) and p-NDRG1(T346) to assess EGFRvIII-mediated mTORC2 signaling. Scale bar, 20 μm. (D) Effect of PTEN reconstitution on EGFRvIII-mediated mTORC2 signaling. (E) Lysates form U87 isogenic cells were subjected to immunoprecipitation with either Rictor antibody or control IgG. Rictor immunoprecipitate was divided into equal fractions for separate kinase reactions using Akt1 purified from insect cells as the substrate. PP242 was added to the kinase reaction in EGFRvIII cells. mTORC2 in vitro kinase activity was assessed by Akt S473 phosphorylation. (F) The schema of EGFRvIII-stimulated mTORC2 signaling. See also Supplementary Figure S1.
Figure 2
Figure 2. mTORC2 promotes GBM cell growth, is resistant to rapamycin treatment and its inhibition has anti-tumor efficacy
(A) U87 and U87/EGFRvIII cells were transfected with Rictor siRNA or scrambled control siRNA constructs for 48 hours in 96-well plates. Relative cell growth was calculated with the cell proliferation assay. Data represent the mean +/− SEM of three independent experiments (Statistically significant with *p<0.05, NS; not significant). (B) U87 cells were transfected with myc-Rictor expressing or empty vectors for 48 hours in 96-well plates. Relative cell growth was calculated with the cell proliferation assay. Data represent the mean +/− SEM of three independent experiments (Statistically significant with *p<0.001). IP; Immunoprecipitation assay, IB; Immunoblot assay (C) Immunohistochemical images of p-Akt(S473), p-NDRG1(T346) and p-S6(S235/236) staining (reddish brown) in tumor samples of GBM patient who received rapamycin treatment. Tissue is counterstained with hematoxylin. Scale bar, 50 μm. (D) Immunoblot analysis of p-Akt(S473), p-NDRG1(T346), and p-S6(S235/236) in U87/EGFRvIII cells with siRNA Rictor and/or rapamycin treatment. (E) Immunoblot analysis using indicated antibodies of U87/EGFRvIII and U251MG cells with the siRNA against Raptor, Rictor or scrambled control. (F) U87/EGFRvIII cells were transfected with siRNA constructs against Raptor, Rictor, or scrambled control for 24 hours in 6-well plates, and changed to 1% FBS medium for 3 days. Cell death was measured by trypan blue exclusion. Data represent the mean +/− SEM of three independent experiments (Statistically significant with *p<0.05, **p<0.01). (G) U251MG cells were transfected with siRNA constructs against Raptor, Rictor, or scrambled control for 24 hours in 6-well plates, and changed to 1% FBS medium for 3 days. Cell death was measured by trypan blue exclusion. Data represent the mean +/− SEM of three independent experiments (Statistically significant with *p<0.05, **p<0.01, #p<0.05, ##p<0.01). See also Supplementary Figure S2, 3 and 4.
Figure 3
Figure 3. EGFRvIII activates NF-κB through mTORC2
(A) Immunoblot analysis of p-p65(S536), p-IκBα(S32/36), and NF-κB target genes such as Bcl-xl and cyclinD1 in whole cell extracts of U87 isogenic cells. (B) EMSAs were performed using nuclear extracts from U87 isogenic cells lysed 48 h after they were cultured in serum free medium. Arrow denotes the DNA/protein EMSA complex. Immunoblot analysis of p65 and TBP which was used to normalize protein loading for nuclear extracts. (C) Luciferase reporter assays targeting NF-κB signal transduction using U87 isogenic cells (measured as relative luciferase/luminescence units). Data represent the mean +/− SEM of three independent experiments (Statistically significant with *p<0.01, **p<0.05). (D) Biochemical analysis of Rictor knockdown on NF-κB signaling in U87/EGFRvIII cells. Cell lines were cultured in serum-free media for 24 hours after transfection of siRNA against Rictor and scramble. (E) Assessment of changes in mRNA levels of NF-κB target gene expression in U87/EGFRvIII cells with knockdown of Rictor and scramble using RT–PCR method. Data represent the mean +/− SEM of three independent experiments. (F) Biochemical analysis of Rictor over-expression on NF-κB signaling in U87 cells. Cell lines were cultured in serum-free media for 24 hours after transfection of myc-Rictor expressing or empty vectors. (G) EMSAs using nuclear extracts from U87 cells transfected with myc-Rictor expressing vector and adenovirus encoding IκB-super repressor (IκBα-SR; a dominant negative mutant of human IκBα). Arrow denotes the DNA/protein EMSA complex, P; positive control, C; control LacZ. (H) Luciferase reporter assays targeting NF-κB signaling in U87 cells transfected with myc-Rictor expressing vector and adenovirus encoding IκBα-SR. Data represent the mean +/− SEM of three independent experiments (Statistically significant with *p<0.001, **p<0.001), C; control LacZ (I) The schema of EGFRvIII-stimulated NF-κB through mTORC2. See also Supplementary Figure S5, 6, 7, 8 and 9.
Figure 4
Figure 4. mTORC2 mediates EGFRvIII-dependent chemotherapy resistance through NF-κB, independent of Akt
(A) Relative cell proliferation of U87, U87/EGFRvIII, U87/EGFRvIII+scrambled control siRNA and U87/EGFRvIII+Rictor siRNA cells with the treatment of varying amounts of cisplatin (CDDP) for 48 hours. Data represent the mean +/− SEM of three independent experiments. (B) Immunoblot analysis using indicated antibodies of U87MG and U87/EGFRvIII transfected with siRNA against Rictor and scrambled control treated with CDDP or normal saline. (C) Immunoblot analysis using indicated antibodies of U87/EGFRvIII infected with adenovirus encoding IκBα-SR treated with CDDP or normal saline. (D) TUNEL staining in U87/EGFRvIII cells transfected with siRNA against Akt1-3, Rictor and scrambled control treated with CDDP (1 μg/ml) or normal saline. The percentage of apoptotic cells was calculated as the percentage of TUNEL-positive cells out of 400 cells for each group using NIH image. Data represent the mean +/− SEM of three independent experiments (Statistically significant with *p<0.01, NS; not significant). Images are magnified x100. (E) TUNEL staining in myc-Rictor expressing U87 cells treated with Akt inhibitor (2.5 μM) or transfected adenovirus encoding IκBα-SR under CDDP treatment (1 μg/ml). D; DMSO. The percentage of apoptotic cells was calculated as the percentage of TUNEL-positive cells out of 400 cells for each group using NIH image. Data represent the mean +/− SEM of three independent experiments (Statistically significant with *p<0.01, NS; not significant). See also Supplementary Figure S9, 10, 11 and 12.
Figure 5
Figure 5. mTORC2 inhibition reverses chemotherapy resistance in vivo
(A) Each mouse was s.c. injected with 3×10⁵ U87/EGFRvIII shRNA control cells (on the left flank) and with 3×10⁵ U87/EGFRvIII shRNA Rictor cells (on the right flank). Mice bearing tumors were treated with i.p. injections of cisplatin (CDDP) (3mg/kg body weight). The control group received equal volume (100 μl) of normal saline (NS). Treatment started 10 days after implantation. Tumor volume was measured, at indicated time points, from xenografts derived from each of 6 mice. Tumor volumes (fold) are measured as indicated in Materials and Methods. Data represent the mean +/− SEM (Statistically significant with **p<0.01, *p<0.05). (B) Representative images of tumor with shRNA Rictor and control treated with CDDP or normal saline. (C) Immunoblot analysis using indicated antibodies of tumor lysates from U87/EGFRvIII shRNA control and shRNA Rictor cells in mice treated with CDDP or normal saline. (D) Representative images demonstrating p-p65(S536) and TUNEL staining (brown cells) to assess apoptotic effects. Quantification of TUNEL staining was performed using NIH image. Data represent the mean +/− SEM of three independent images (Statistically significant with *p<0.001). Scale bar, 20 μm. See also Supplementary Figure S13.
Figure 6
Figure 6. mTORC2 signaling is hyperactivated in the majority of clinical GBM samples, in association with NF-κB and phospho-EGFR
(A) The schema of each correlation of EGFR/mTORC2/NF-κB signaling on Tissue microarray (TMA) analysis. P-value and Odds Ratio (OR) were determined by Chi- square for independence test. (B) Immunohistochemical images of p-EGFR(Y1068), p-Akt(S473), Rictor, p-NDRG1(T346) and p-p65(S536) staining (reddish brown) in two TMAs comprising 252 tumor cores from 140 primary GBM patients. Tissue is counterstained with hematoxylin. Scale bar, 20 μm. (C) Immunohistochemical analysis of TMAs based on correlation of p-p65(S536) with p-Akt(S473), p-NDRG1(T346) and p-EGFR(Y1068). Numbers may not add up to 252 because of missing cores. P-value was determined by Chi-square for independence test (Statistically significant with **p<0.001, *p<0.05). (D) Representative gross and microscopic pictures of tumor tissue (T) and contralateral normal brain tissue (N) from the brain of a GBM patient obtained at autopsy. Scale bar, 100 μm. (E) Immunoblot analysis of Rictor, p-Akt(S473), p-NDRG1(T346), and p-p65(S536) staining in tumor (T) and contralateral normal brain tissue (N) from three GBM patients obtained at autopsy. See also Supplementary Table S1.
Figure 7
Figure 7. EGFRvIII stimulates NF-κB activity through mTORC2
(A) EGFRvIII stimulates mTORC2 activity; PTEN suppressed it (B) mTORC2 promotes NF-κB activity. (C) mTORC2 mediates EGFRvIII-stimulated NF-κB activation promoting tumor growth, survival and chemotherapy resistance.

Comment in

Similar articles

Cited by

References

    1. Guertin DA, Sabatini DM. The pharmacology of mTOR inhibition. Sci Signal. 2009;2:pe24. - PubMed
    1. Ma XM, Blenis J. Molecular mechanisms of mTOR-mediated translational control. Nat Rev Mol Cell Biol. 2009;10:307–18. - PubMed
    1. Duvel K, Yecies JL, Menon S, Raman P, Lipovsky AI, Souza AL, et al. Activation of a metabolic gene regulatory network downstream of mTOR complex 1. Mol Cell. 2010;39:171–83. - PMC - PubMed
    1. Guertin DA, Stevens DM, Thoreen CC, Burds AA, Kalaany NY, Moffat J, et al. Ablation in mice of the mTORC components raptor, rictor, or mLST8 reveals that mTORC2 is required for signaling to Akt-FOXO and PKCalpha, but not S6K1. Dev Cell. 2006;11:859–71. - PubMed
    1. Sarbassov DD, Guertin DA, Ali SM, Sabatini DM. Phosphorylation and regulation of Akt/PKB by the rictor-mTOR complex. Science. 2005;307:1098–101. - PubMed

Publication types

MeSH terms