

Protein conformational gating of enzymatic activity in xanthine oxidoreductase
- PMID: 22145797
- PMCID: PMC3264664
- DOI: 10.1021/ja207173p
Protein conformational gating of enzymatic activity in xanthine oxidoreductase
Abstract
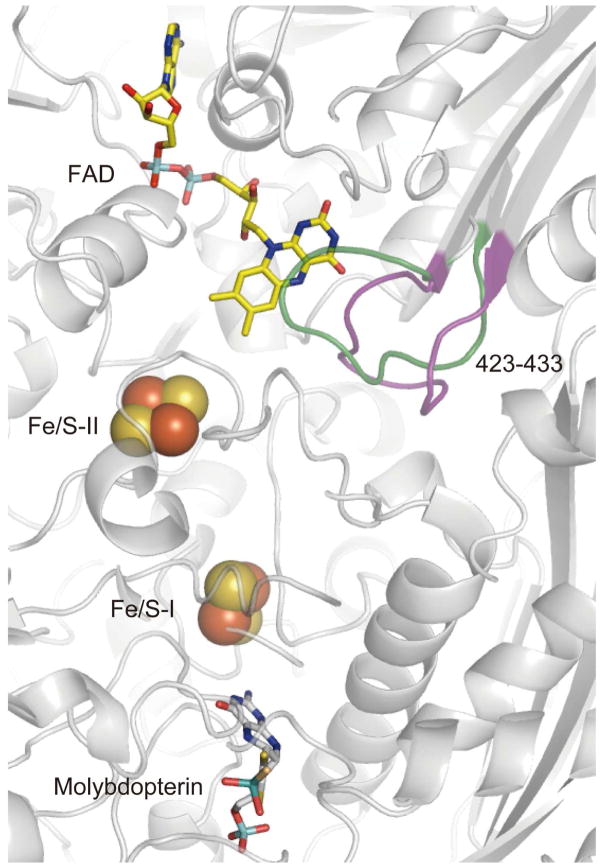
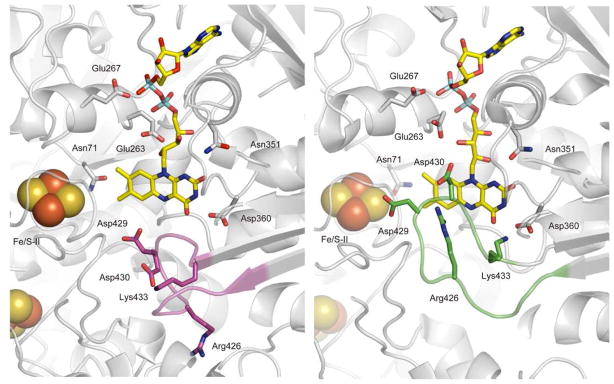
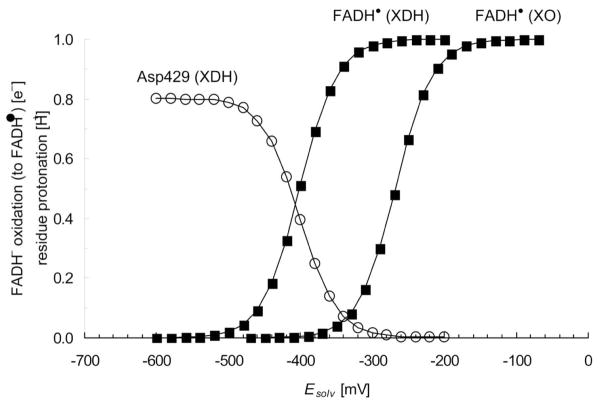
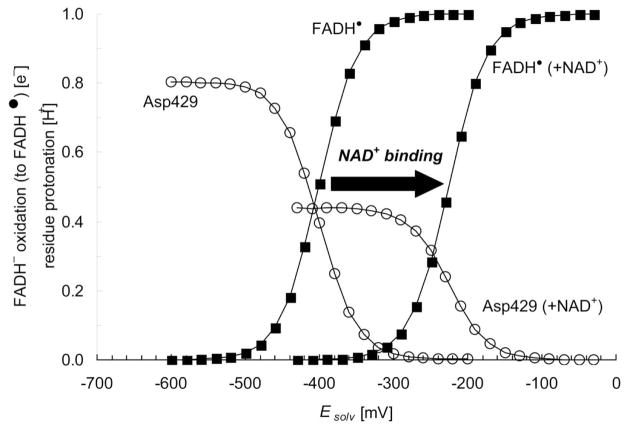
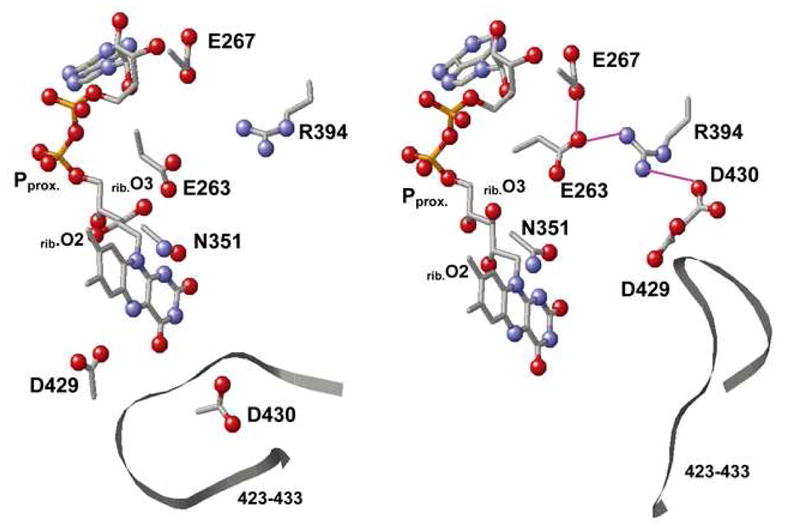
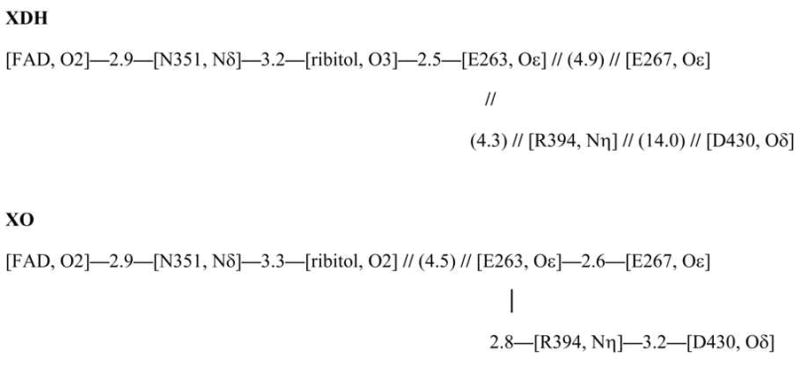
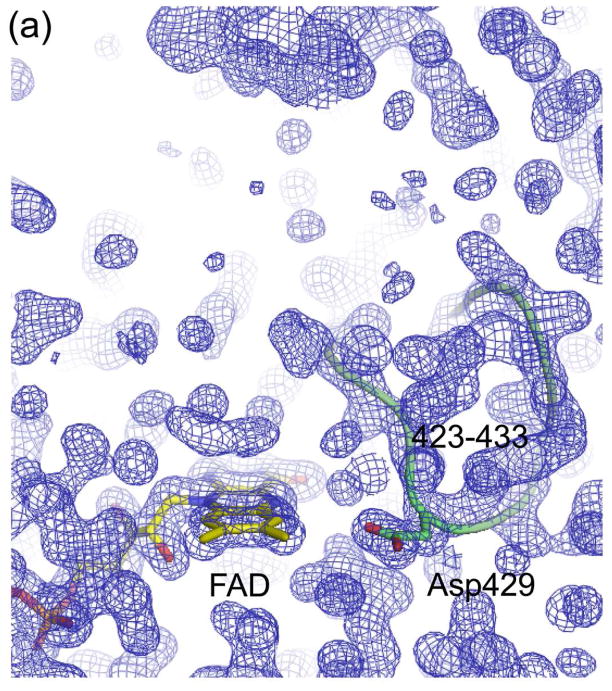
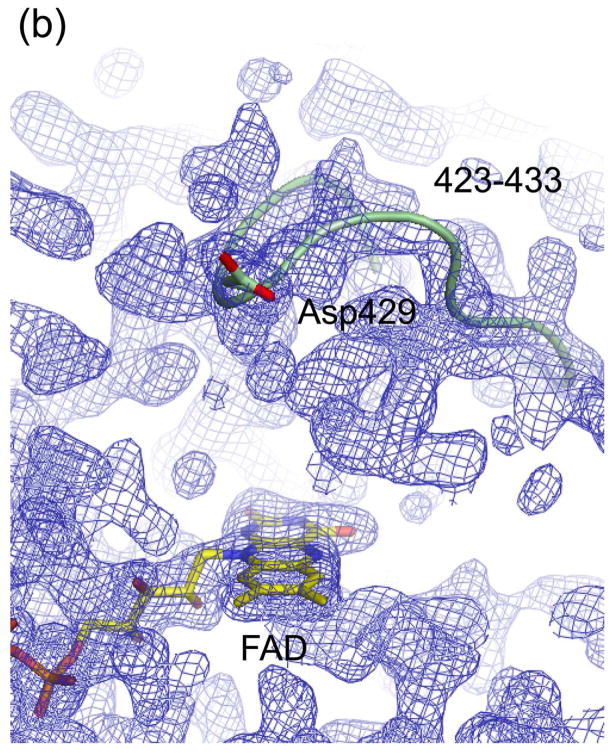
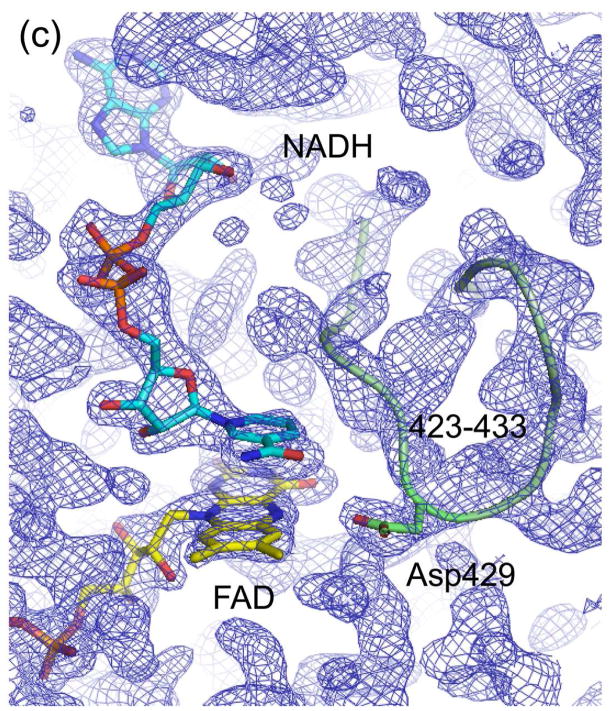
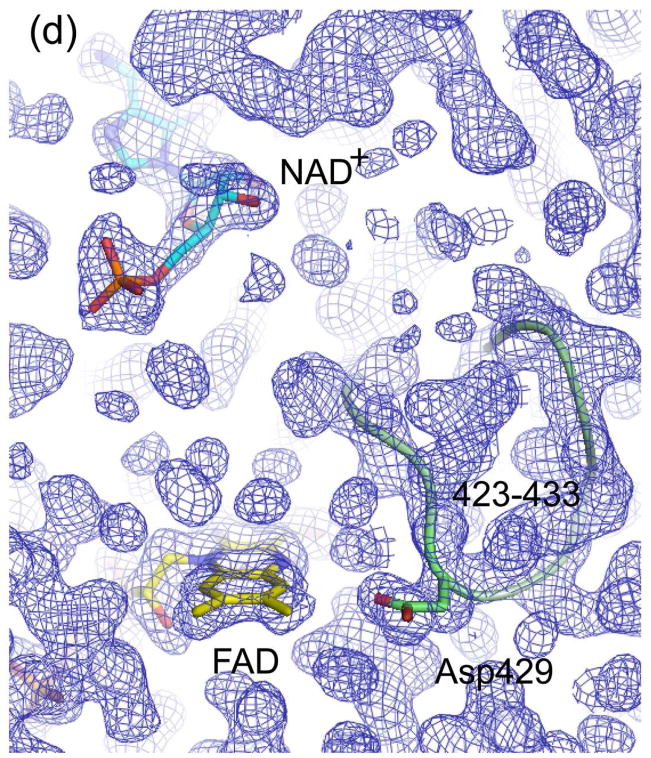
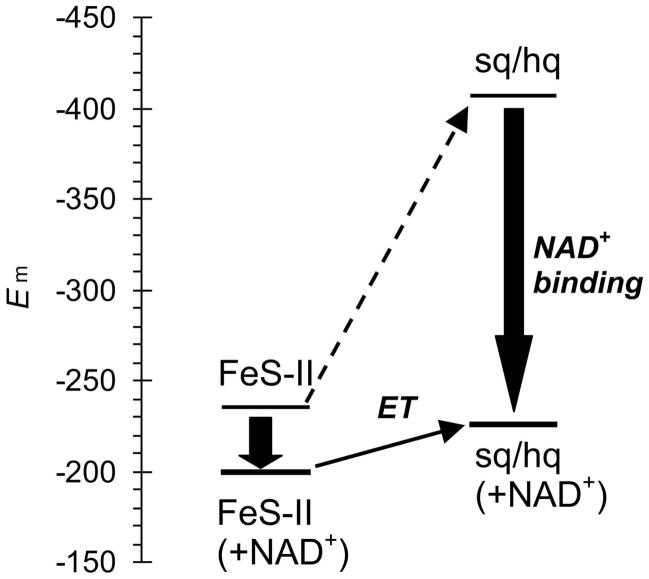
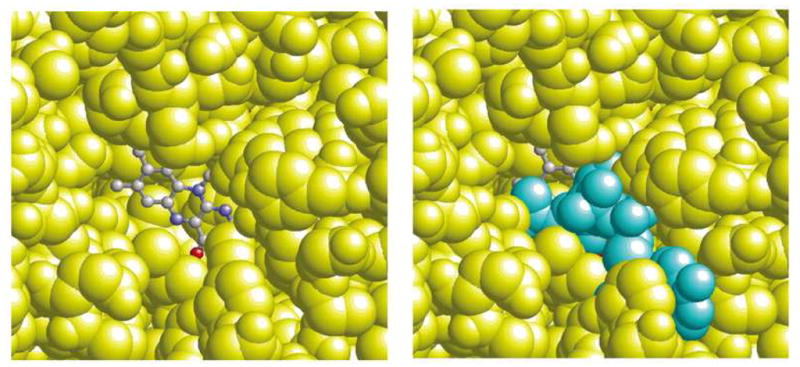
In mammals, xanthine oxidoreductase can exist as xanthine dehydrogenase (XDH) and xanthine oxidase (XO). The two enzymes possess common redox active cofactors, which form an electron transfer (ET) pathway terminated by a flavin cofactor. In spite of identical protein primary structures, the redox potential difference between XDH and XO for the flavin semiquinone/hydroquinone pair (E(sq/hq)) is ~170 mV, a striking difference. The former greatly prefers NAD(+) as ultimate substrate for ET from the iron-sulfur cluster FeS-II via flavin while the latter only accepts dioxygen. In XDH (without NAD(+)), however, the redox potential of the electron donor FeS-II is 180 mV higher than that for the acceptor flavin, yielding an energetically uphill ET. On the basis of new 1.65, 2.3, 1.9, and 2.2 Å resolution crystal structures for XDH, XO, the NAD(+)- and NADH-complexed XDH, E(sq/hq) were calculated to better understand how the enzyme activates an ET from FeS-II to flavin. The majority of the E(sq/hq) difference between XDH and XO originates from a conformational change in the loop at positions 423-433 near the flavin binding site, causing the differences in stability of the semiquinone state. There was no large conformational change observed in response to NAD(+) binding at XDH. Instead, the positive charge of the NAD(+) ring, deprotonation of Asp429, and capping of the bulk surface of the flavin by the NAD(+) molecule all contribute to altering E(sq/hq) upon NAD(+) binding to XDH.
© 2011 American Chemical Society
Figures
Similar articles
-
Role of the flavin midpoint potential and NAD binding in determining NAD versus oxygen reactivity of xanthine oxidoreductase.J Biol Chem. 1999 Feb 19;274(8):4561-9. doi: 10.1074/jbc.274.8.4561. J Biol Chem. 1999. PMID: 9988690
-
Purification and properties of milk xanthine dehydrogenase.J Biol Chem. 1992 Oct 25;267(30):21479-85. J Biol Chem. 1992. PMID: 1328233
-
Unique amino acids cluster for switching from the dehydrogenase to oxidase form of xanthine oxidoreductase.Proc Natl Acad Sci U S A. 2003 Jul 8;100(14):8170-5. doi: 10.1073/pnas.1431485100. Epub 2003 Jun 19. Proc Natl Acad Sci U S A. 2003. PMID: 12817083 Free PMC article.
-
The role of the [2Fe-2s] cluster centers in xanthine oxidoreductase.J Inorg Biochem. 2000 Nov;82(1-4):43-9. doi: 10.1016/s0162-0134(00)00165-3. J Inorg Biochem. 2000. PMID: 11132637 Review.
-
Mammalian xanthine oxidoreductase - mechanism of transition from xanthine dehydrogenase to xanthine oxidase.FEBS J. 2008 Jul;275(13):3278-89. doi: 10.1111/j.1742-4658.2008.06489.x. Epub 2008 May 30. FEBS J. 2008. PMID: 18513323 Review.
Cited by
-
Molybdenum's Role as an Essential Element in Enzymes Catabolizing Redox Reactions: A Review.Biomolecules. 2024 Jul 19;14(7):869. doi: 10.3390/biom14070869. Biomolecules. 2024. PMID: 39062583 Free PMC article. Review.
-
Association of Mutations Identified in Xanthinuria with the Function and Inhibition Mechanism of Xanthine Oxidoreductase.Biomedicines. 2021 Nov 20;9(11):1723. doi: 10.3390/biomedicines9111723. Biomedicines. 2021. PMID: 34829959 Free PMC article. Review.
-
Design, synthesis, molecular docking and biological evaluation of new carbazole derivatives as anticancer, and antioxidant agents.BMC Chem. 2023 Jun 16;17(1):60. doi: 10.1186/s13065-023-00961-y. BMC Chem. 2023. PMID: 37328860 Free PMC article.
-
Electron transfer pathways in a multiheme cytochrome MtrF.Proc Natl Acad Sci U S A. 2017 Mar 14;114(11):2916-2921. doi: 10.1073/pnas.1617615114. Epub 2017 Mar 6. Proc Natl Acad Sci U S A. 2017. PMID: 28265060 Free PMC article.
-
Iron-sulfur flavoenzymes: the added value of making the most ancient redox cofactors and the versatile flavins work together.Open Biol. 2021 May;11(5):210010. doi: 10.1098/rsob.210010. Epub 2021 May 5. Open Biol. 2021. PMID: 33947244 Free PMC article.
References
Publication types
MeSH terms
Substances
Grants and funding
LinkOut - more resources
Full Text Sources
Miscellaneous
