. 2011 Dec:1239:100-8.
doi: 10.1111/j.1749-6632.2011.06223.x.

The prefrontal cortex and hybrid learning during iterative competitive games

Affiliations

The prefrontal cortex and hybrid learning during iterative competitive games

Hiroshi Abe et al. Ann N Y Acad Sci. 2011 Dec.

Abstract

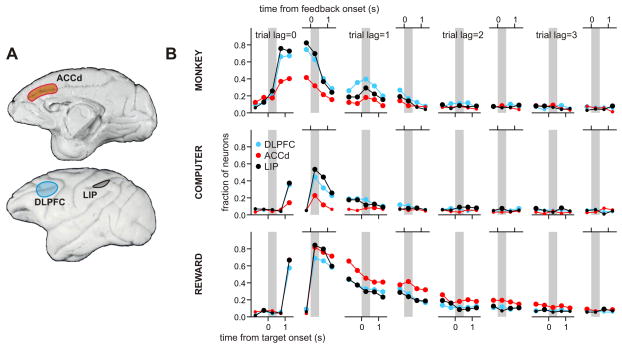
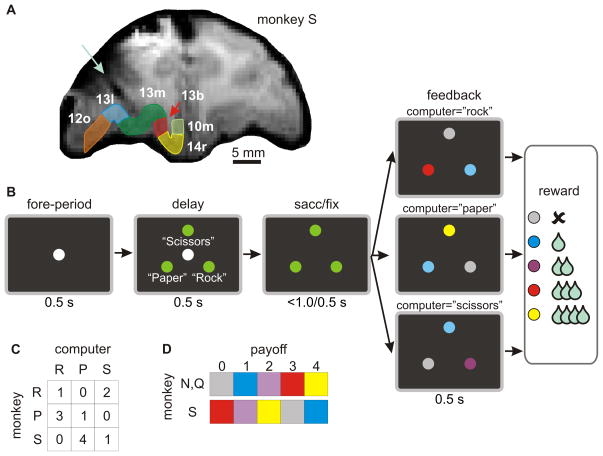
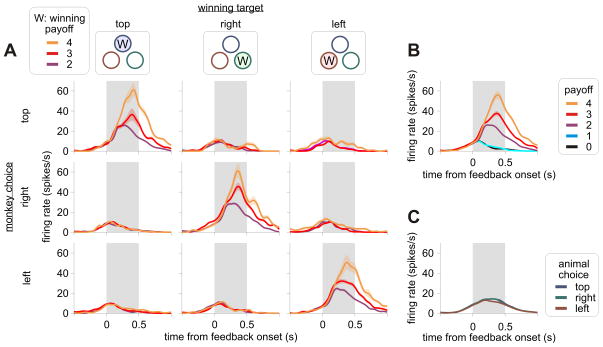
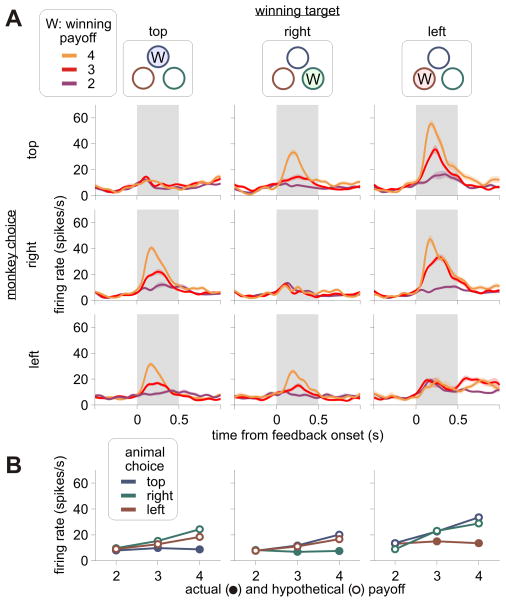
Behavioral changes driven by reinforcement and punishment are referred to as simple or model-free reinforcement learning. Animals can also change their behaviors by observing events that are neither appetitive nor aversive when these events provide new information about payoffs available from alternative actions. This is an example of model-based reinforcement learning and can be accomplished by incorporating hypothetical reward signals into the value functions for specific actions. Recent neuroimaging and single-neuron recording studies showed that the prefrontal cortex and the striatum are involved not only in reinforcement and punishment, but also in model-based reinforcement learning. We found evidence for both types of learning, and hence hybrid learning, in monkeys during simulated competitive games. In addition, in both the dorsolateral prefrontal cortex and orbitofrontal cortex, individual neurons heterogeneously encoded signals related to actual and hypothetical outcomes from specific actions, suggesting that both areas might contribute to hybrid learning.


Conflict of interest statement

Conflicts of interest

The authors declare no conflicts of interest.

Figures

Figure 1
Figure 1
A. Medial (top) and lateral (bottom) views of the rhesus monkeys’ brain, showing the locations of recorded areas in dorsolateral prefrontal cortex (DLPFC),, dorsal anterior cingulate cortex (ACCd), and lateral intraparietal cortex (LIP). B. Temporal changes in the fraction of neurons significantly modulating their activity according to the animal’s choice (top), choice of the computer opponent (equivalent to action-outcome conjunction; middle), and the outcome of the animal’s choice (bottom) in the current (trial lag=0) and 3 previous trials (trial lag=1 to 3) during a computer-simulated matching-pennies task. The results for each trial lag are shown in two sub-panels showing the proportion of neurons in each cortical area modulating their activity significantly according to the corresponding factor relative to the time of target onset (left panels) or feedback onset (right panels). Large symbols indicate that the proportion of neurons was significantly higher than the chance level (binomial test, p<0.05). Gray background corresponds to the delay period (left panels) or feedback period (right panels).
Figure 2
Figure 2
A. Magnetic resonance image of a rhesus monkey used for neurophysiological recording experiments during a rock-paper-scissors task. Numbers indicate different cytoarchitectonic divisions of the orbitofrontal cortex. A light blue arrow indicates an electrode track. B. Temporal sequence of a rock-paper-scissors task used to investigate neuronal signals related to hypothetical outcomes. The amount of reward delivered 0.5 s after feedback onset was determined by the payoff matrix of a biased rock-paper-scissors task (C). D. Feedback colors used to indicate different payoffs. N, Q, S refer to the three monkeys trained on this task.
Figure 3
Figure 3
An example OFC neuron that modulated its activity only according to the actual outcome of the animal’s choice. A. Average spike density function estimated separately according to the position of the winning target (columns), the position of the target chosen by the animal (rows), and the winning payoff (colors). Thus, the results shown in the main diagonal are from the winning trials. B. Average spike density functions shown as a function of actual payoffs. C. Average spike density function shown as a function of the animal’s choice.
Figure 4
Figure 4
An example OFC neuron that modulated its activity according to the hypothetical outcome from the winning target. A. Same format as in Figure 3A. B. The average spike rate estimated separately according to the position of the winning target (columns) and the position of the target chosen by the animal (colors).

Similar articles

Cited by

References

    1. Sutton RS, Barto AG. Reinforcement learning: an introduction. MIT Press; Massachusetts: 1998.
    1. Lohrenz T, McCabe K, Camerer CF, Montague PR. Neural signature of fictive learning signals in a sequential investment task. Proc Natl Acad Sci USA. 2007;104:9493–9498. - PMC - PubMed
    1. Boorman ED, Behrens TE, Rushworth MF. Counterfactual choice and learning in a neural network centered on human lateral frontopolar cortex. PLoS Biol. 2011;9:e1001093. - PMC - PubMed
    1. Tolman EC. Cognitive maps in rats and men. Psychol Rev. 1948;55:189–208. - PubMed
    1. Balleine BW, Dickinson A. Goal-directed instrumental action: contingency and incentive learning and their cortical substrates. Neuropharmacology. 1998;37:407–419. - PubMed

Publication types