. 2012 Mar;103(3):528-34.
doi: 10.1111/j.1349-7006.2011.02177.x. Epub 2012 Jan 13.

Downregulating hypoxia-inducible factor-2α improves the efficacy of doxorubicin in the treatment of hepatocellular carcinoma

Affiliations

Downregulating hypoxia-inducible factor-2α improves the efficacy of doxorubicin in the treatment of hepatocellular carcinoma

Changjun He et al. Cancer Sci. 2012 Mar.

Abstract

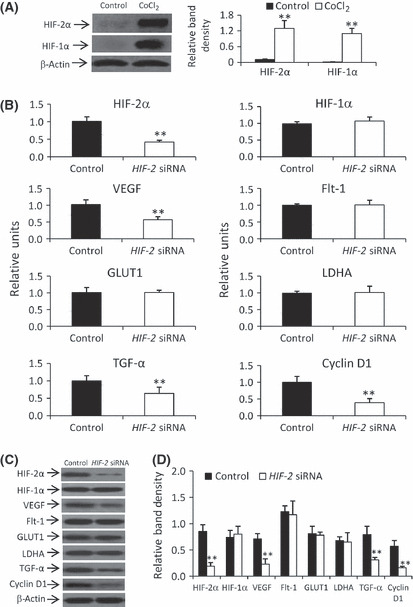
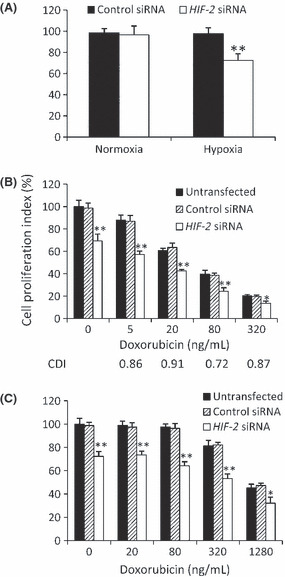
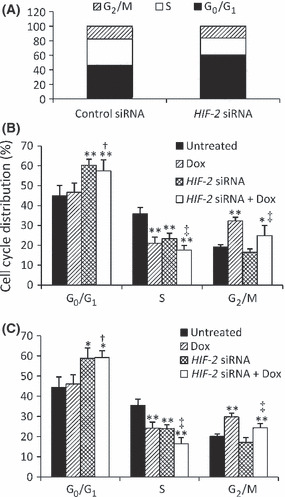
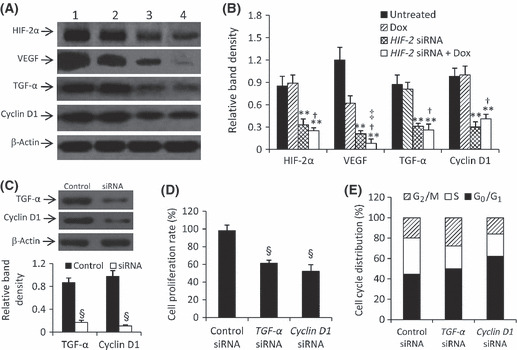
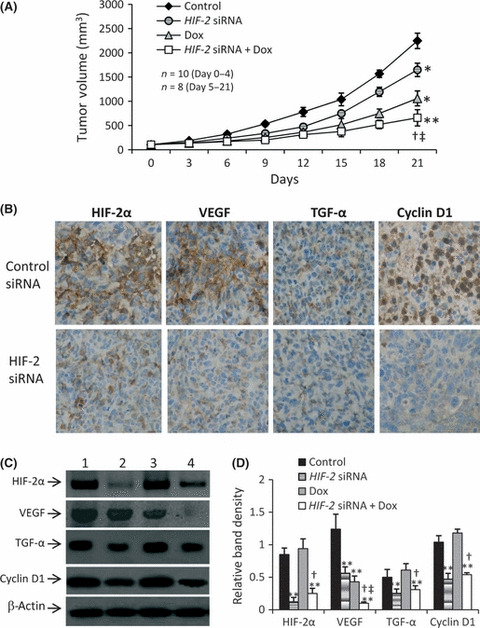
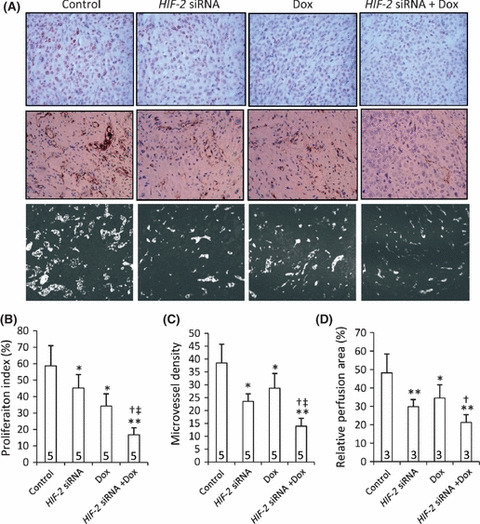
The hypoxic microenvironment inside solid tumors, including hepatocellular carcinoma (HCC), is a major cause of tumor resistance to chemotherapy. The recently identified hypoxia-inducible factor (HIF)-2 executes the hypoxia response. Its expression feature and transcriptional targets indicate a possible dominance of HIF-2 in regulating genes in HCC. The aim of the present study was to determine whether transfection of siRNA targeting HIF-2α could enhance the efficacy of doxorubicin, the most commonly used drug in the treatment of HCC. Transfection of HIF-2 siRNA into human HCC cells downregulated the expression of HIF-2α, vascular endothelial growth factor (VEGF), transforming growth factor (TGF)-α, and cyclin D1, but had little effect on the expression of HIF-1α, fms-related tyrosine kinase-1 (Flt-1), the glucose transporter (GLUT)-1, and lactate dehydrogenase A (LDHA). Doxorubicin itself only downregulated VEGF expression. Furthermore, HIF-2 siRNA inhibited proliferation, induced cell cycle arrest at the G(0)/G(1) phase, and acted synergistically with doxorubicin to inhibit the growth of human HCC cells in vitro. Transfection of HIF-2 siRNA also downregulated tumoral expression of HIF-2α, VEGF, TGF-α, and cyclin D1 in vivo, and acted synergistically with doxorubicin to suppress the growth of HepG2 tumors established in immunodeficient mice by inhibiting cell proliferation, tumor angiogenesis and microvessel perfusion. The results of the present study suggest that targeting HIF-2α with siRNA warrants investigation as a potential strategy to enhance the efficacy of doxorubicin in the treatment of HCC.


Figures

Figure 1
Figure 1
Downregulating gene expression by HIF‐2 siRNA in HepG2 cells in vitro. (A) Cells were incubated in the presence or absence of CoCl2 for 24 h and the expression of hypoxia‐inducible factor (HIF)‐1α and HIF‐2α was determined by western blot analysis and normalized against that of β‐actin. (B–D) Control or HIF‐2 siRNA‐transfected cells were incubated for 24 h in the presence of CoCl2 and harvested for mRNA analysis by quantitative RT‐PCR (B) or protein expression by western blot analysis (C). (D) The density of each band in (C) was measured and normalized against that of β‐actin. Data are the mean ± SD. **P <0.001 compared with control. VEGF, vascular endothelial growth factor; Flt‐1, fms‐related tyrosine kinase‐1; GLUT1, glucose transporter 1; LDHA, lactate dehydrogenase A; TGF‐α, transforming growth factor‐α.
Figure 2
Figure 2
Cell proliferation in vitro. (A) HepG2 cells transfected with control or HIF‐2 siRNA were cultured in the absence (normoxia) or presence (hypoxia) of CoCl2 for 48 h. (B,C) Untransfected HepG2 (B) or Hep3B (C) cells or cells transfected with control or HIF‐2 siRNA were incubated with doxorubicin in the presence of CoCl2 for 48 h. Data are the mean ± SD. *P <0.05, **P <0.001 compared with control siRNA.
Figure 3
Figure 3
Cell cycle arrest in vitro. (A) Control or HIF‐2 siRNA‐transfected HepG2 cells were cultured in the presence of CoCl2 for 48 h. (B,C) Untransfected HepG2 (B) or Hep3B (C) cells or cells transfected with control or HIF‐2 siRNA were incubated with 80 or 500 ng/mL doxorubicin (Dox), respectively, in the presence of CoCl2 for 48 h. Data are the mean ± SD. *P <0.05, **P <0.001 compared with untreated cells; †P <0.05 compared with Dox‐treated cells; ‡P <0.05 compared with HIF‐2 siRNA‐treated cells.
Figure 4
Figure 4
Gene expression and effects of downregulating downstream genes. (A) Untreated HepG2 cells (lane 1) or cells treated with doxorubicin (Dox; lane 2), HIF‐2 siRNA (lane 3) or HIF‐2 siRNA + Dox (lane 4; from Fig. 3B) were subjected to western blot analysis. (B) The density of each band in (A) was measured and normalized against that of β‐actin. Data are the mean ± SD. *P <0.05, **P <0.001 compared with untreated cells; †P <0.05 compared with Dox‐treated cells; ‡P <0.05 compared with HIF‐2 siRNA‐treated cells. (C–E) Control siRNA, transforming growth factor (TGF)‐α siRNA or Cyclin D1 siRNA‐transfected HepG2 cells were cultured in the presence of CoCl2 for 48 h; the expression of TGF‐α and Cyclin D1 was determined by western blot analysis (C), with band density normalized against that of β‐actin, and cell proliferation (D) and cell cycle distribution (E) were measured. Data are the mean ± SD. §P <0.001 compared with control.
Figure 5
Figure 5
Tumor growth and gene expression in vivo. (A) Tumor size in the control, doxorubicin‐ (Dox), HIF‐2 siRNA‐ and HIF‐2 siRNA + Dox‐treated groups for n mice in each group at the different time points. (B) Representative sections of tumors injected with control siRNA or HIF‐2 siRNA and stained brown with Abs against hypoxia‐inducible factor (HIF)‐2α, vascular endothelial growth factor (VEGF), transforming growth factor (TGF)‐α, or cyclin D1 (original magnification ×400). (C) Tumor homogenates from the control (lane 1), HIF‐2 siRNA (lane 2), doxorubicin (lane 3) and HIF‐2 siRNA + doxorubicin (lane 4) groups were subjected to western blot analysis to determine the expression of HIF‐2α, VEGF, TGF‐α and cyclin D1. (D) The density of each band was normalized against that of β‐actin. Data are the mean ± SD. *P <0.05, **P <0.001 compared with untreated cells; †P <0.05 compared with Dox‐treated cells; ‡P <0.05 compared with HIF‐2 siRNA‐treated cells.
Figure 6
Figure 6
Tumoral cell proliferation, angiogenesis and microvessel perfusion. (A) Representative tumor sections prepared 3 weeks after treatment (from Fig. 5) and stained with an anti‐Ki‐67 Ab (upper panel) or an anti‐CD31 Ab (middle panel), or prepared from mice preinjected with Hoechst 33342 (represented by light‐colored regions). The proliferation index (B), microvessel density (C), and microvessel perfusion area (D) were determined for each group. Dox, doxorubicin. Data are the mean ± SD, with the number of samples indicated by the numbers at the bottom of each column. *P <0.05, **P <0.001 compared with untreated cells; †P <0.05 compared with Dox‐treated cells; ‡P <0.05 compared with HIF‐2 siRNA‐treated cells.

References

    1. Jemal A, Bray F, Center MM, Ferlay J, Ward E, Forman D. Global cancer statistics. CA Cancer J Clin 2011; 61: 69–90. - PubMed
    1. Samuel M, Chow PK, Chan Shih‐Yen E, Machin D, Soo KC. Neoadjuvant and adjuvant therapy for surgical resection of hepatocellular carcinoma. Cochrane Database Syst Rev 2009; 21: CD001199. - PMC - PubMed
    1. Bruix J, Sherman M. Management of hepatocellular carcinoma: an update. Hepatology 2011; 53: 1020–2. - PMC - PubMed
    1. Gish RG, Porta C, Lazar L et al. Phase III randomized controlled trial comparing the survival of patients with unresectable hepatocellular carcinoma treated with nolatrexed or doxorubicin. J Clin Oncol 2007; 25: 3069–75. - PubMed
    1. Rankin EB, Giaccia AJ. The role of hypoxia‐inducible factors in tumorigenesis. Cell Death Differ 2008; 15: 678–85. - PMC - PubMed

Publication types

MeSH terms

Substances